![]()
This project is done to practice data wrangling (or data munging). The truth is that data cannot always be used as it is and needs preparation in a way so that it can be used. Some cleaning and wrangling needs to be done before we can do analysis on them. In this project, we will make use of the the Death Statistics 2019 data obtained from Department of Statistics Malaysia. Also included is a simple visualization to give some insights about the data. All of these process are made using Python.
1. Questions
This analysis will try to answer the following questions:
- Which gender live longer, men or women?
- What is the leasing cause of death in Malaysia?
- Which state has the highest death and death rate?
2. Measurement Priorities
- Count of deaths of each gender by each age group.
- The death cause with the most count of casualty.
- The count of death cases in each state in Malaysia.
3. Data Collection
- Source
- The data is obtained from the Department of Statistics Malaysia Website.
- Storage
- The cleaned data will be stored in a CSV file.
Github link for project
Data is obtained from:
JADUAL PENERBITAN PERANGKAAN SEBAB KEMATIAN, MALAYSIA, 2020
Statistics on Causes of Death, Malaysia, 2020 presents statistics on major causes of death by classification for 2019. The Department of Statistics Malaysia (DOSM) uses the International Statistical Classification of Diseases and Related Health Problems, 10th Revision (ICD-10) published by the World Health Organization (2010 ) as reference material for coding the cause of death.
Import Data
import pandas as pd
xls = pd.ExcelFile('dataset\death_cause_malaysia_2020.xlsx')
Data Cleaning
Table 1.1: Deaths (number and rate) by state and sex, Malaysia, 2019
Preview table
df_gen = pd.read_excel(xls,sheet_name="1.1")
df_gen
| Jadual 1.1: Kematian (bilangan dan kadar) mengikut negeri dan jantina, Malaysia, 2019 | Unnamed: 1 | Unnamed: 2 | Unnamed: 3 | Unnamed: 4 | Unnamed: 5 | Unnamed: 6 | Unnamed: 7 | Unnamed: 8 | Unnamed: 9 | Unnamed: 10 | |
|---|---|---|---|---|---|---|---|---|---|---|---|
| 0 | Table 1.1: Deaths (number and rate) by state a... | NaN | NaN | NaN | NaN | NaN | NaN | NaN | NaN | NaN | NaN |
| 1 | NaN | NaN | NaN | NaN | NaN | NaN | NaN | NaN | NaN | NaN | NaN |
| 2 | NaN | NaN | Kematian | NaN | NaN | NaN | Kadar kematian kasar | NaN | NaN | NaN | NaN |
| 3 | NaN | NaN | Deaths | NaN | NaN | NaN | Crude death rate | NaN | NaN | NaN | NaN |
| 4 | NaN | NaN | Jumlah | Lelaki | Perempuan | NaN | Jumlah | Lelaki | Perempuan | NaN | NaN |
| 5 | NaN | NaN | Total | Male | Female | NaN | Total | Male | Female | NaN | NaN |
| 6 | NaN | NaN | NaN | NaN | NaN | NaN | NaN | NaN | NaN | NaN | NaN |
| 7 | MALAYSIA | NaN | 173746 | 99681 | 74065 | NaN | 5.342242 | 5.945819 | 4.700105 | NaN | NaN |
| 8 | NaN | Johor | 21776 | 12743 | 9033 | NaN | 5.789692 | 6.453459 | 5.056066 | NaN | NaN |
| 9 | NaN | Kedah | 14292 | 8027 | 6265 | NaN | 6.574828 | 7.287441 | 5.842794 | NaN | NaN |
| 10 | NaN | Kelantan | 11389 | 6436 | 4953 | NaN | 6.045617 | 6.759489 | 5.316083 | NaN | NaN |
| 11 | NaN | Melaka | 5542 | 3084 | 2458 | NaN | 5.96941 | 6.619759 | 5.314342 | NaN | NaN |
| 12 | NaN | Negeri Sembilan | 7157 | 4097 | 3060 | NaN | 6.355022 | 7.056639 | 5.608422 | NaN | NaN |
| 13 | NaN | Pahang | 9165 | 5381 | 3784 | NaN | 5.483302 | 6.067542 | 4.822913 | NaN | NaN |
| 14 | NaN | Perak | 18712 | 10554 | 8158 | NaN | 7.458543 | 8.322346 | 6.575591 | NaN | NaN |
| 15 | NaN | Perlis | 1994 | 1124 | 870 | NaN | 7.84891 | 8.886218 | 6.82032 | NaN | NaN |
| 16 | NaN | Pulau Pinang | 10879 | 6101 | 4778 | NaN | 6.150355 | 6.862011 | 5.431132 | NaN | NaN |
| 17 | NaN | Sabah | 14493 | 8439 | 6054 | NaN | 3.711919 | 4.142434 | 3.242217 | NaN | NaN |
| 18 | NaN | Sarawak | 13990 | 7888 | 6102 | NaN | 4.985706 | 5.401526 | 4.534463 | NaN | NaN |
| 19 | NaN | Selangor | 27700 | 16142 | 11558 | NaN | 4.257525 | 4.782697 | 3.69142 | NaN | NaN |
| 20 | NaN | Terengganu | 7334 | 4201 | 3133 | NaN | 5.893177 | 6.634565 | 5.125219 | NaN | NaN |
| 21 | NaN | W.P. Kuala Lumpur | 8819 | 5168 | 3651 | NaN | 4.94744 | 5.646853 | 4.209432 | NaN | NaN |
| 22 | NaN | W.P. Labuan | 296 | 182 | 114 | NaN | 2.981166 | 3.637308 | 2.31458 | NaN | NaN |
| 23 | NaN | W.P. Putrajaya | 208 | 114 | 94 | NaN | 2.006715 | 2.347853 | 1.706082 | NaN | NaN |
| 24 | NaN | NaN | NaN | NaN | NaN | NaN | NaN | NaN | NaN | NaN | NaN |
| 25 | NaN | NaN | NaN | NaN | NaN | NaN | NaN | NaN | NaN | NaN | NaN |
| 26 | Kadar adalah bagi setiap 1,000 penduduk | NaN | NaN | NaN | NaN | NaN | NaN | NaN | NaN | NaN | NaN |
| 27 | The rates are per 1,000 population | NaN | NaN | NaN | NaN | NaN | NaN | NaN | NaN | NaN | NaN |
Remove unwanted rows and columns
df_gen = df_gen.iloc[8: , :]
df_gen = df_gen.iloc[:-4]
df_gen = df_gen.iloc[:,1:]
df_gen = df_gen.iloc[:,:-2]
df_gen.drop('Unnamed: 5',axis=1,inplace=True)
df_gen
| Unnamed: 1 | Unnamed: 2 | Unnamed: 3 | Unnamed: 4 | Unnamed: 6 | Unnamed: 7 | Unnamed: 8 | |
|---|---|---|---|---|---|---|---|
| 8 | Johor | 21776 | 12743 | 9033 | 5.789692 | 6.453459 | 5.056066 |
| 9 | Kedah | 14292 | 8027 | 6265 | 6.574828 | 7.287441 | 5.842794 |
| 10 | Kelantan | 11389 | 6436 | 4953 | 6.045617 | 6.759489 | 5.316083 |
| 11 | Melaka | 5542 | 3084 | 2458 | 5.96941 | 6.619759 | 5.314342 |
| 12 | Negeri Sembilan | 7157 | 4097 | 3060 | 6.355022 | 7.056639 | 5.608422 |
| 13 | Pahang | 9165 | 5381 | 3784 | 5.483302 | 6.067542 | 4.822913 |
| 14 | Perak | 18712 | 10554 | 8158 | 7.458543 | 8.322346 | 6.575591 |
| 15 | Perlis | 1994 | 1124 | 870 | 7.84891 | 8.886218 | 6.82032 |
| 16 | Pulau Pinang | 10879 | 6101 | 4778 | 6.150355 | 6.862011 | 5.431132 |
| 17 | Sabah | 14493 | 8439 | 6054 | 3.711919 | 4.142434 | 3.242217 |
| 18 | Sarawak | 13990 | 7888 | 6102 | 4.985706 | 5.401526 | 4.534463 |
| 19 | Selangor | 27700 | 16142 | 11558 | 4.257525 | 4.782697 | 3.69142 |
| 20 | Terengganu | 7334 | 4201 | 3133 | 5.893177 | 6.634565 | 5.125219 |
| 21 | W.P. Kuala Lumpur | 8819 | 5168 | 3651 | 4.94744 | 5.646853 | 4.209432 |
| 22 | W.P. Labuan | 296 | 182 | 114 | 2.981166 | 3.637308 | 2.31458 |
| 23 | W.P. Putrajaya | 208 | 114 | 94 | 2.006715 | 2.347853 | 1.706082 |
Rename Columns
dict = {'Unnamed: 1': 'state_death',
        'Unnamed: 2': 'total_death',
        'Unnamed: 3': 'male_death',
        'Unnamed: 4': 'female_death',
        'Unnamed: 6': 'total_death_rate',
        'Unnamed: 7': 'male_death_rate',
        'Unnamed: 8': 'female_death_rate',

       }

df_gen.rename(columns=dict,
          inplace=True)
Reset Index
df_gen.reset_index(drop=True,inplace=True)
df_gen
| state_death | total_death | male_death | female_death | total_death_rate | male_death_rate | female_death_rate | |
|---|---|---|---|---|---|---|---|
| 0 | Johor | 21776 | 12743 | 9033 | 5.789692 | 6.453459 | 5.056066 |
| 1 | Kedah | 14292 | 8027 | 6265 | 6.574828 | 7.287441 | 5.842794 |
| 2 | Kelantan | 11389 | 6436 | 4953 | 6.045617 | 6.759489 | 5.316083 |
| 3 | Melaka | 5542 | 3084 | 2458 | 5.96941 | 6.619759 | 5.314342 |
| 4 | Negeri Sembilan | 7157 | 4097 | 3060 | 6.355022 | 7.056639 | 5.608422 |
| 5 | Pahang | 9165 | 5381 | 3784 | 5.483302 | 6.067542 | 4.822913 |
| 6 | Perak | 18712 | 10554 | 8158 | 7.458543 | 8.322346 | 6.575591 |
| 7 | Perlis | 1994 | 1124 | 870 | 7.84891 | 8.886218 | 6.82032 |
| 8 | Pulau Pinang | 10879 | 6101 | 4778 | 6.150355 | 6.862011 | 5.431132 |
| 9 | Sabah | 14493 | 8439 | 6054 | 3.711919 | 4.142434 | 3.242217 |
| 10 | Sarawak | 13990 | 7888 | 6102 | 4.985706 | 5.401526 | 4.534463 |
| 11 | Selangor | 27700 | 16142 | 11558 | 4.257525 | 4.782697 | 3.69142 |
| 12 | Terengganu | 7334 | 4201 | 3133 | 5.893177 | 6.634565 | 5.125219 |
| 13 | W.P. Kuala Lumpur | 8819 | 5168 | 3651 | 4.94744 | 5.646853 | 4.209432 |
| 14 | W.P. Labuan | 296 | 182 | 114 | 2.981166 | 3.637308 | 2.31458 |
| 15 | W.P. Putrajaya | 208 | 114 | 94 | 2.006715 | 2.347853 | 1.706082 |
Convert to appropriate data types
cols = df_gen.columns.drop('state_death')
df_gen[cols] = df_gen[cols].apply(pd.to_numeric, errors='coerce')
df_gen.dtypes
state_death           object
total_death            int64
male_death             int64
female_death           int64
total_death_rate     float64
male_death_rate      float64
female_death_rate    float64
dtype: object
Export cleaned table
df_gen
| state_death | total_death | male_death | female_death | total_death_rate | male_death_rate | female_death_rate | |
|---|---|---|---|---|---|---|---|
| 0 | Johor | 21776 | 12743 | 9033 | 5.789692 | 6.453459 | 5.056066 |
| 1 | Kedah | 14292 | 8027 | 6265 | 6.574828 | 7.287441 | 5.842794 |
| 2 | Kelantan | 11389 | 6436 | 4953 | 6.045617 | 6.759489 | 5.316083 |
| 3 | Melaka | 5542 | 3084 | 2458 | 5.969410 | 6.619759 | 5.314342 |
| 4 | Negeri Sembilan | 7157 | 4097 | 3060 | 6.355022 | 7.056639 | 5.608422 |
| 5 | Pahang | 9165 | 5381 | 3784 | 5.483302 | 6.067542 | 4.822913 |
| 6 | Perak | 18712 | 10554 | 8158 | 7.458543 | 8.322346 | 6.575591 |
| 7 | Perlis | 1994 | 1124 | 870 | 7.848910 | 8.886218 | 6.820320 |
| 8 | Pulau Pinang | 10879 | 6101 | 4778 | 6.150355 | 6.862011 | 5.431132 |
| 9 | Sabah | 14493 | 8439 | 6054 | 3.711919 | 4.142434 | 3.242217 |
| 10 | Sarawak | 13990 | 7888 | 6102 | 4.985706 | 5.401526 | 4.534463 |
| 11 | Selangor | 27700 | 16142 | 11558 | 4.257525 | 4.782697 | 3.691420 |
| 12 | Terengganu | 7334 | 4201 | 3133 | 5.893177 | 6.634565 | 5.125219 |
| 13 | W.P. Kuala Lumpur | 8819 | 5168 | 3651 | 4.947440 | 5.646853 | 4.209432 |
| 14 | W.P. Labuan | 296 | 182 | 114 | 2.981166 | 3.637308 | 2.314580 |
| 15 | W.P. Putrajaya | 208 | 114 | 94 | 2.006715 | 2.347853 | 1.706082 |
df_gen.to_csv('cleaned_data/death_rate_by_state_and_sex_2019.csv',index=False)
Table 1.3: Deaths by age group and sex, Malaysia, 2019
Preview table
df = pd.read_excel(xls,sheet_name="1.3")
df
| Jadual 1.3: Kematian mengikut kumpulan umur dan jantina, Malaysia, 2019 | Unnamed: 1 | Unnamed: 2 | Unnamed: 3 | Unnamed: 4 | Unnamed: 5 | Unnamed: 6 | Unnamed: 7 | Unnamed: 8 | Unnamed: 9 | Unnamed: 10 | Unnamed: 11 | |
|---|---|---|---|---|---|---|---|---|---|---|---|---|
| 0 | Table 1.3: Deaths by age group and sex, Malays... | NaN | NaN | NaN | NaN | NaN | NaN | NaN | NaN | NaN | NaN | NaN |
| 1 | NaN | NaN | NaN | NaN | NaN | NaN | NaN | NaN | NaN | NaN | NaN | NaN |
| 2 | NaN | NaN | NaN | NaN | NaN | NaN | NaN | NaN | NaN | NaN | NaN | NaN |
| 3 | Kumpulan umur | Jumlah | Lelaki | Perempuan | NaN | NaN | NaN | NaN | NaN | NaN | NaN | NaN |
| 4 | Age group | Total | Male | Female | NaN | NaN | NaN | NaN | NaN | NaN | NaN | NaN |
| 5 | NaN | NaN | NaN | NaN | NaN | NaN | NaN | NaN | NaN | NaN | NaN | NaN |
| 6 | NaN | NaN | NaN | NaN | NaN | NaN | NaN | NaN | NaN | NaN | NaN | NaN |
| 7 | Jumlah/Total | 173746 | 99681 | 74065 | NaN | NaN | NaN | NaN | NaN | NaN | NaN | NaN |
| 8 | Kurang 1 tahun/Under 1 year | 3117 | 1711 | 1406 | NaN | NaN | NaN | NaN | NaN | NaN | NaN | NaN |
| 9 | Kurang 1 hari/Under 1 day | 652 | 351 | 301 | NaN | NaN | NaN | NaN | NaN | NaN | NaN | NaN |
| 10 | 1 hari hingga < 1 minggu/1 day to < 1 week | 842 | 467 | 375 | NaN | NaN | NaN | NaN | NaN | NaN | NaN | NaN |
| 11 | 1 minggu hingga < 4 minggu/1 week to < 4 weeks | 486 | 267 | 219 | NaN | NaN | NaN | NaN | NaN | NaN | NaN | NaN |
| 12 | 4 minggu hingga < 3 bulan/4 weeks to < 3 months | 459 | 248 | 211 | NaN | NaN | NaN | NaN | NaN | NaN | NaN | NaN |
| 13 | 3 bulan hingga < 6 bulan/3 months to < 6 months | 349 | 195 | 154 | NaN | NaN | NaN | NaN | NaN | NaN | NaN | NaN |
| 14 | 6 bulan hingga < 9 bulan/6 months to < 9 months | 203 | 120 | 83 | NaN | NaN | NaN | NaN | NaN | NaN | NaN | NaN |
| 15 | 9 bulan hingga < 12 bulan/9 months to < 12 mon... | 126 | 63 | 63 | NaN | NaN | NaN | NaN | NaN | NaN | NaN | NaN |
| 16 | 1 tahun/1 year | 167 | 87 | 80 | NaN | NaN | NaN | NaN | NaN | NaN | NaN | NaN |
| 17 | 2 tahun/2 years | 233 | 135 | 98 | NaN | NaN | NaN | NaN | NaN | NaN | NaN | NaN |
| 18 | 3 tahun/3 years | 133 | 68 | 65 | NaN | NaN | NaN | NaN | NaN | NaN | NaN | NaN |
| 19 | 4 tahun/4 years | 115 | 71 | 44 | NaN | NaN | NaN | NaN | NaN | NaN | NaN | NaN |
| 20 | 0-4 | 3765 | 2072 | 1693 | NaN | NaN | NaN | NaN | NaN | NaN | NaN | NaN |
| 21 | 5-9 | 596 | 352 | 244 | NaN | NaN | NaN | NaN | NaN | NaN | NaN | NaN |
| 22 | 10-14 | 656 | 384 | 272 | NaN | NaN | NaN | NaN | NaN | NaN | NaN | NaN |
| 23 | 15-19 | 1591 | 1215 | 376 | NaN | NaN | NaN | NaN | NaN | NaN | NaN | NaN |
| 24 | 20-24 | 2136 | 1615 | 521 | NaN | NaN | NaN | NaN | NaN | NaN | NaN | NaN |
| 25 | 25-29 | 2423 | 1718 | 705 | NaN | NaN | NaN | NaN | NaN | NaN | NaN | NaN |
| 26 | 30-34 | 3017 | 2081 | 936 | NaN | NaN | NaN | NaN | NaN | NaN | NaN | NaN |
| 27 | 35-39 | 4144 | 2803 | 1341 | NaN | NaN | NaN | NaN | NaN | NaN | NaN | NaN |
| 28 | 40-44 | 5591 | 3778 | 1813 | NaN | NaN | NaN | NaN | NaN | NaN | NaN | NaN |
| 29 | 45-49 | 7436 | 4944 | 2492 | NaN | NaN | NaN | NaN | NaN | NaN | NaN | NaN |
| 30 | 50-54 | 10717 | 6919 | 3798 | NaN | NaN | NaN | NaN | NaN | NaN | NaN | NaN |
| 31 | 55-59 | 14572 | 9334 | 5238 | NaN | NaN | NaN | NaN | NaN | NaN | NaN | NaN |
| 32 | 60-64 | 18046 | 11275 | 6771 | NaN | NaN | NaN | NaN | NaN | NaN | NaN | NaN |
| 33 | 65-69 | 19539 | 11855 | 7684 | NaN | NaN | NaN | NaN | NaN | NaN | NaN | NaN |
| 34 | 70-74 | 20351 | 11901 | 8450 | NaN | NaN | NaN | NaN | NaN | NaN | NaN | NaN |
| 35 | 75-79 | 19672 | 10737 | 8935 | NaN | NaN | NaN | NaN | NaN | NaN | NaN | NaN |
| 36 | 80-84 | 19479 | 9201 | 10278 | NaN | NaN | NaN | NaN | NaN | NaN | NaN | NaN |
| 37 | 85 dan lebih/85 and over | 20015 | 7497 | 12518 | NaN | NaN | NaN | NaN | NaN | NaN | NaN | NaN |
Remove unwanted rows and columns
df = df.iloc[8: , :]
df.head()
| Jadual 1.3: Kematian mengikut kumpulan umur dan jantina, Malaysia, 2019 | Unnamed: 1 | Unnamed: 2 | Unnamed: 3 | Unnamed: 4 | Unnamed: 5 | Unnamed: 6 | Unnamed: 7 | Unnamed: 8 | Unnamed: 9 | Unnamed: 10 | Unnamed: 11 | |
|---|---|---|---|---|---|---|---|---|---|---|---|---|
| 8 | Kurang 1 tahun/Under 1 year | 3117 | 1711 | 1406 | NaN | NaN | NaN | NaN | NaN | NaN | NaN | NaN |
| 9 | Kurang 1 hari/Under 1 day | 652 | 351 | 301 | NaN | NaN | NaN | NaN | NaN | NaN | NaN | NaN |
| 10 | 1 hari hingga < 1 minggu/1 day to < 1 week | 842 | 467 | 375 | NaN | NaN | NaN | NaN | NaN | NaN | NaN | NaN |
| 11 | 1 minggu hingga < 4 minggu/1 week to < 4 weeks | 486 | 267 | 219 | NaN | NaN | NaN | NaN | NaN | NaN | NaN | NaN |
| 12 | 4 minggu hingga < 3 bulan/4 weeks to < 3 months | 459 | 248 | 211 | NaN | NaN | NaN | NaN | NaN | NaN | NaN | NaN |
df = df.iloc[:,:-8]
dict = {'Jadual 1.3: Kematian mengikut kumpulan umur dan jantina, Malaysia, 2019': 'age_group',
        'Unnamed: 1': 'total_death_group',
        'Unnamed: 2': 'male_death_age',
        'Unnamed: 3': 'female_death_age',
        }

df.rename(columns=dict,
          inplace=True)
df.reset_index(drop=True, inplace=True)
df.head()
| age_group | total_death_group | male_death_age | female_death_age | |
|---|---|---|---|---|
| 0 | Kurang 1 tahun/Under 1 year | 3117 | 1711 | 1406 |
| 1 | Kurang 1 hari/Under 1 day | 652 | 351 | 301 |
| 2 | 1 hari hingga < 1 minggu/1 day to < 1 week | 842 | 467 | 375 |
| 3 | 1 minggu hingga < 4 minggu/1 week to < 4 weeks | 486 | 267 | 219 |
| 4 | 4 minggu hingga < 3 bulan/4 weeks to < 3 months | 459 | 248 | 211 |
df['age_group']=df.age_group.str.replace(".*/", '')
<ipython-input-219-bda0008f5b22>:1: FutureWarning: The default value of regex will change from True to False in a future version.
  df['age_group']=df.age_group.str.replace(".*/", '')
df.head()
| age_group | total_death_group | male_death_age | female_death_age | |
|---|---|---|---|---|
| 0 | Under 1 year | 3117 | 1711 | 1406 |
| 1 | Under 1 day | 652 | 351 | 301 |
| 2 | 1 day to < 1 week | 842 | 467 | 375 |
| 3 | 1 week to < 4 weeks | 486 | 267 | 219 |
| 4 | 4 weeks to < 3 months | 459 | 248 | 211 |
df.to_csv('cleaned_data/death_rate_by_age_group_and_sex_2019.csv',index=False)
Table 1.6: Ten principal causes of death (medically certified and non-medically certified) by sex, Malaysia, 2019
Preview table
df = pd.read_excel(xls,sheet_name=r"1.6(1)")
df
| Jadual 1.6: Sepuluh sebab kematian utama (disahkan dan tidak disahkan secara perubatan) | Unnamed: 1 | Unnamed: 2 | Unnamed: 3 | Unnamed: 4 | Unnamed: 5 | Unnamed: 6 | Unnamed: 7 | Unnamed: 8 | Unnamed: 9 | Unnamed: 10 | Unnamed: 11 | Unnamed: 12 | Unnamed: 13 | Unnamed: 14 | |
|---|---|---|---|---|---|---|---|---|---|---|---|---|---|---|---|
| 0 | NaN | mengikut jantina, Malaysia, 2019 | NaN | NaN | NaN | NaN | NaN | NaN | NaN | NaN | NaN | NaN | NaN | NaN | NaN |
| 1 | Table 1.6: Ten principal causes of death (medi... | NaN | NaN | NaN | NaN | NaN | NaN | NaN | NaN | NaN | NaN | NaN | NaN | NaN | NaN |
| 2 | NaN | NaN | NaN | NaN | NaN | NaN | NaN | NaN | NaN | NaN | NaN | NaN | NaN | NaN | NaN |
| 3 | Jumlah/Total | NaN | NaN | NaN | NaN | NaN | NaN | NaN | NaN | NaN | NaN | NaN | NaN | NaN | NaN |
| 4 | NaN | Disahkan secara perubatan | Bil. | NaN | NaN | NaN | NaN | NaN | NaN | NaN | NaN | NaN | NaN | NaN | NaN |
| 5 | NaN | Medically certified | No. | % | NaN | NaN | NaN | NaN | NaN | NaN | NaN | NaN | NaN | NaN | NaN |
| 6 | NaN | NaN | NaN | NaN | NaN | NaN | NaN | NaN | NaN | NaN | NaN | NaN | NaN | NaN | NaN |
| 7 | 1. | Ischaemic heart diseases | 16325 | 14.954564 | NaN | NaN | NaN | NaN | NaN | NaN | NaN | NaN | NaN | NaN | NaN |
| 8 | 2. | Pneumonia | 13356 | 12.234803 | NaN | NaN | NaN | NaN | NaN | NaN | NaN | NaN | NaN | NaN | NaN |
| 9 | 3. | Cerebrovascular diseases | 8691 | 7.961416 | NaN | NaN | NaN | NaN | NaN | NaN | NaN | NaN | NaN | NaN | NaN |
| 10 | 4. | Transport accidents | 4198 | 3.84559 | NaN | NaN | NaN | NaN | NaN | NaN | NaN | NaN | NaN | NaN | NaN |
| 11 | 5. | Malignant neoplasm of trachea, bronchus and lung | 2602 | 2.38357 | NaN | NaN | NaN | NaN | NaN | NaN | NaN | NaN | NaN | NaN | NaN |
| 12 | 6. | Chronic lower respiratory diseases | 2312 | 2.117914 | NaN | NaN | NaN | NaN | NaN | NaN | NaN | NaN | NaN | NaN | NaN |
| 13 | 7. | Diabetes mellitus | 2008 | 1.839434 | NaN | NaN | NaN | NaN | NaN | NaN | NaN | NaN | NaN | NaN | NaN |
| 14 | 8. | Malignant neoplasm of colon, rectum and anus | 1873 | 1.715767 | NaN | NaN | NaN | NaN | NaN | NaN | NaN | NaN | NaN | NaN | NaN |
| 15 | 9. | Malignant neoplasm of breast | 1869 | 1.712103 | NaN | NaN | NaN | NaN | NaN | NaN | NaN | NaN | NaN | NaN | NaN |
| 16 | 10. | Diseases of the liver | 1601 | 1.466601 | NaN | NaN | NaN | NaN | NaN | NaN | NaN | NaN | NaN | NaN | NaN |
| 17 | NaN | Keseluruhan sebab ... | 109164 | NaN | NaN | NaN | NaN | NaN | NaN | NaN | NaN | NaN | NaN | NaN | NaN |
| 18 | NaN | NaN | NaN | NaN | NaN | NaN | NaN | NaN | NaN | NaN | NaN | NaN | NaN | NaN | NaN |
| 19 | NaN | Tidak disahkan secara perubatan | Bil. | NaN | NaN | NaN | NaN | NaN | NaN | NaN | NaN | NaN | NaN | NaN | NaN |
| 20 | NaN | Non-medically certified | No. | % | NaN | NaN | NaN | NaN | NaN | NaN | NaN | NaN | NaN | NaN | NaN |
| 21 | NaN | NaN | NaN | NaN | NaN | NaN | NaN | NaN | NaN | NaN | NaN | NaN | NaN | NaN | NaN |
| 22 | 1. | Sakit tua 65 tahun dan lebih ... | 30665 | 47.482271 | NaN | NaN | NaN | NaN | NaN | NaN | NaN | NaN | NaN | NaN | NaN |
| 23 | 2. | Darah tinggi ... | 2393 | 3.705367 | NaN | NaN | NaN | NaN | NaN | NaN | NaN | NaN | NaN | NaN | NaN |
| 24 | 3. | Kencing manis ... | 1997 | 3.092193 | NaN | NaN | NaN | NaN | NaN | NaN | NaN | NaN | NaN | NaN | NaN |
| 25 | 4. | Penyakit serebrovaskular ... | 1708 | 2.6447 | NaN | NaN | NaN | NaN | NaN | NaN | NaN | NaN | NaN | NaN | NaN |
| 26 | 5. | Lelah ... | 1076 | 1.66455 | NaN | NaN | NaN | NaN | NaN | NaN | NaN | NaN | NaN | NaN | NaN |
| 27 | 6. | Penyakit jantung iskemia ... | 1023 | 1.584033 | NaN | NaN | NaN | NaN | NaN | NaN | NaN | NaN | NaN | NaN | NaN |
| 28 | 7. | Barah trakea, bronkus dan paru-paru ... | 742 | 1.148927 | NaN | NaN | NaN | NaN | NaN | NaN | NaN | NaN | NaN | NaN | NaN |
| 29 | 8. | Barah kolon, rektum dan dubur ... | 715 | 1.10712 | NaN | NaN | NaN | NaN | NaN | NaN | NaN | NaN | NaN | NaN | NaN |
| 30 | 9. | Barah hati ... | 533 | 0.825307 | NaN | NaN | NaN | NaN | NaN | NaN | NaN | NaN | NaN | NaN | NaN |
| 31 | 10. | Barah payu dara ... | 524 | 0.811372 | NaN | NaN | NaN | NaN | NaN | NaN | NaN | NaN | NaN | NaN | NaN |
| 32 | NaN | Keseluruhan sebab ... | 64582 | NaN | NaN | NaN | NaN | NaN | NaN | NaN | NaN | NaN | NaN | NaN | NaN |
Remove unwanted rows and columns
df = df.iloc[:,1:]
df = df.iloc[:,:-11]
df = df.iloc[7: , :]
df
| Unnamed: 1 | Unnamed: 2 | Unnamed: 3 | |
|---|---|---|---|
| 7 | Ischaemic heart diseases | 16325 | 14.954564 |
| 8 | Pneumonia | 13356 | 12.234803 |
| 9 | Cerebrovascular diseases | 8691 | 7.961416 |
| 10 | Transport accidents | 4198 | 3.84559 |
| 11 | Malignant neoplasm of trachea, bronchus and lung | 2602 | 2.38357 |
| 12 | Chronic lower respiratory diseases | 2312 | 2.117914 |
| 13 | Diabetes mellitus | 2008 | 1.839434 |
| 14 | Malignant neoplasm of colon, rectum and anus | 1873 | 1.715767 |
| 15 | Malignant neoplasm of breast | 1869 | 1.712103 |
| 16 | Diseases of the liver | 1601 | 1.466601 |
| 17 | Keseluruhan sebab ... | 109164 | NaN |
| 18 | NaN | NaN | NaN |
| 19 | Tidak disahkan secara perubatan | Bil. | NaN |
| 20 | Non-medically certified | No. | % |
| 21 | NaN | NaN | NaN |
| 22 | Sakit tua 65 tahun dan lebih ... | 30665 | 47.482271 |
| 23 | Darah tinggi ... | 2393 | 3.705367 |
| 24 | Kencing manis ... | 1997 | 3.092193 |
| 25 | Penyakit serebrovaskular ... | 1708 | 2.6447 |
| 26 | Lelah ... | 1076 | 1.66455 |
| 27 | Penyakit jantung iskemia ... | 1023 | 1.584033 |
| 28 | Barah trakea, bronkus dan paru-paru ... | 742 | 1.148927 |
| 29 | Barah kolon, rektum dan dubur ... | 715 | 1.10712 |
| 30 | Barah hati ... | 533 | 0.825307 |
| 31 | Barah payu dara ... | 524 | 0.811372 |
| 32 | Keseluruhan sebab ... | 64582 | NaN |
Rename Columns
dict = {'Unnamed: 1': 'death_cause',
        'Unnamed: 2': 'death_count',
        'Unnamed: 3': 'percentage',
       }

df.rename(columns=dict,
          inplace=True)
Split tables
df_med = df.iloc[0:10 , :]
df_xmed = df.iloc[15:25 , :]
df
| death_cause | death_count | percentage | |
|---|---|---|---|
| 7 | Ischaemic heart diseases | 16325 | 14.954564 |
| 8 | Pneumonia | 13356 | 12.234803 |
| 9 | Cerebrovascular diseases | 8691 | 7.961416 |
| 10 | Transport accidents | 4198 | 3.84559 |
| 11 | Malignant neoplasm of trachea, bronchus and lung | 2602 | 2.38357 |
| 12 | Chronic lower respiratory diseases | 2312 | 2.117914 |
| 13 | Diabetes mellitus | 2008 | 1.839434 |
| 14 | Malignant neoplasm of colon, rectum and anus | 1873 | 1.715767 |
| 15 | Malignant neoplasm of breast | 1869 | 1.712103 |
| 16 | Diseases of the liver | 1601 | 1.466601 |
| 17 | Keseluruhan sebab ... | 109164 | NaN |
| 18 | NaN | NaN | NaN |
| 19 | Tidak disahkan secara perubatan | Bil. | NaN |
| 20 | Non-medically certified | No. | % |
| 21 | NaN | NaN | NaN |
| 22 | Sakit tua 65 tahun dan lebih ... | 30665 | 47.482271 |
| 23 | Darah tinggi ... | 2393 | 3.705367 |
| 24 | Kencing manis ... | 1997 | 3.092193 |
| 25 | Penyakit serebrovaskular ... | 1708 | 2.6447 |
| 26 | Lelah ... | 1076 | 1.66455 |
| 27 | Penyakit jantung iskemia ... | 1023 | 1.584033 |
| 28 | Barah trakea, bronkus dan paru-paru ... | 742 | 1.148927 |
| 29 | Barah kolon, rektum dan dubur ... | 715 | 1.10712 |
| 30 | Barah hati ... | 533 | 0.825307 |
| 31 | Barah payu dara ... | 524 | 0.811372 |
| 32 | Keseluruhan sebab ... | 64582 | NaN |
Certification Label
df_med['certification'] = 'medical'
df_xmed['certification'] = 'non-medical'
<ipython-input-231-738d62170e63>:1: SettingWithCopyWarning:
A value is trying to be set on a copy of a slice from a DataFrame.
Try using .loc[row_indexer,col_indexer] = value instead

See the caveats in the documentation: https://pandas.pydata.org/pandas-docs/stable/user_guide/indexing.html#returning-a-view-versus-a-copy
  df_med['certification'] = 'medical'
<ipython-input-231-738d62170e63>:2: SettingWithCopyWarning:
A value is trying to be set on a copy of a slice from a DataFrame.
Try using .loc[row_indexer,col_indexer] = value instead

See the caveats in the documentation: https://pandas.pydata.org/pandas-docs/stable/user_guide/indexing.html#returning-a-view-versus-a-copy
  df_xmed['certification'] = 'non-medical'
df_xmed['death_cause'] = df_xmed.death_cause.str.replace(' +', '/')
<ipython-input-232-58ca563d90ad>:1: FutureWarning: The default value of regex will change from True to False in a future version.
  df_xmed['death_cause'] = df_xmed.death_cause.str.replace('  +', '/')
<ipython-input-232-58ca563d90ad>:1: SettingWithCopyWarning:
A value is trying to be set on a copy of a slice from a DataFrame.
Try using .loc[row_indexer,col_indexer] = value instead

See the caveats in the documentation: https://pandas.pydata.org/pandas-docs/stable/user_guide/indexing.html#returning-a-view-versus-a-copy
  df_xmed['death_cause'] = df_xmed.death_cause.str.replace('  +', '/')
df_xmed['death_cause']=df_xmed.death_cause.str.replace(".*/", '')
<ipython-input-233-d35e3569a3bb>:1: FutureWarning: The default value of regex will change from True to False in a future version.
  df_xmed['death_cause']=df_xmed.death_cause.str.replace(".*/", '')
<ipython-input-233-d35e3569a3bb>:1: SettingWithCopyWarning:
A value is trying to be set on a copy of a slice from a DataFrame.
Try using .loc[row_indexer,col_indexer] = value instead

See the caveats in the documentation: https://pandas.pydata.org/pandas-docs/stable/user_guide/indexing.html#returning-a-view-versus-a-copy
  df_xmed['death_cause']=df_xmed.death_cause.str.replace(".*/", '')
Combine DataFrames
df = df_med.append(df_xmed,ignore_index = True)
Reset Index
df.reset_index(drop=True,inplace=True)
df
| death_cause | death_count | percentage | certification | |
|---|---|---|---|---|
| 0 | Ischaemic heart diseases | 16325 | 14.954564 | medical |
| 1 | Pneumonia | 13356 | 12.234803 | medical |
| 2 | Cerebrovascular diseases | 8691 | 7.961416 | medical |
| 3 | Transport accidents | 4198 | 3.84559 | medical |
| 4 | Malignant neoplasm of trachea, bronchus and lung | 2602 | 2.38357 | medical |
| 5 | Chronic lower respiratory diseases | 2312 | 2.117914 | medical |
| 6 | Diabetes mellitus | 2008 | 1.839434 | medical |
| 7 | Malignant neoplasm of colon, rectum and anus | 1873 | 1.715767 | medical |
| 8 | Malignant neoplasm of breast | 1869 | 1.712103 | medical |
| 9 | Diseases of the liver | 1601 | 1.466601 | medical |
| 10 | Old age 65 years and over | 30665 | 47.482271 | non-medical |
| 11 | Hypertension | 2393 | 3.705367 | non-medical |
| 12 | Diabetes mellitus | 1997 | 3.092193 | non-medical |
| 13 | Cerebrovascular diseases | 1708 | 2.6447 | non-medical |
| 14 | Asthma | 1076 | 1.66455 | non-medical |
| 15 | Ischaemic heart diseases | 1023 | 1.584033 | non-medical |
| 16 | Trachea, bronchus and lung cancer | 742 | 1.148927 | non-medical |
| 17 | Colon, rectum and anus cancer | 715 | 1.10712 | non-medical |
| 18 | Liver cancer | 533 | 0.825307 | non-medical |
| 19 | Breast cancer | 524 | 0.811372 | non-medical |
Export Cleaned Table
df.to_csv('cleaned_data/death_causes_2019.csv',index=False)
Visualization
import matplotlib.pyplot as plt
import numpy as np
import seaborn as sns
Death by gender in 2019
df = pd.read_csv('cleaned_data/death_rate_by_age_group_and_sex_2019.csv')
df.head()
| age_group | total_death_group | male_death_age | female_death_age | |
|---|---|---|---|---|
| 0 | Under 1 year | 3117 | 1711 | 1406 |
| 1 | Under 1 day | 652 | 351 | 301 |
| 2 | 1 day to < 1 week | 842 | 467 | 375 |
| 3 | 1 week to < 4 weeks | 486 | 267 | 219 |
| 4 | 4 weeks to < 3 months | 459 | 248 | 211 |
import matplotlib.pyplot as plt
import seaborn as sns
fig = plt.figure(figsize=(10,5),facecolor='1')
plt.title("Death by age group in Malaysia")


sns.barplot(data=df, x='age_group',y='total_death_group')
plt.xticks(rotation=90)
plt.show()
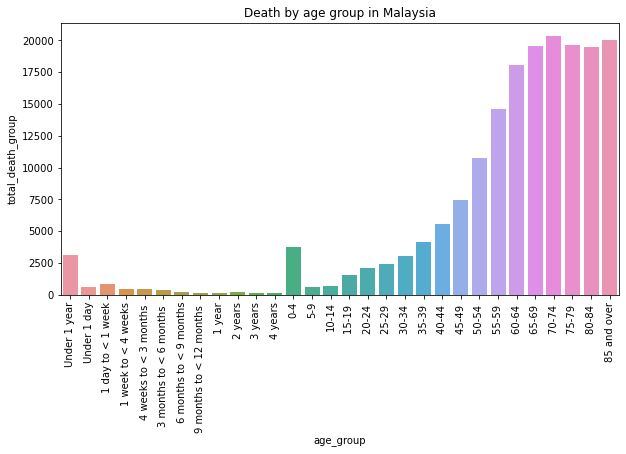
Description: From the graph, we can see the distribution of total death count by age group in Malaysia. From the graph, we can see that people in Malaysia mostly died at the age 70-74 which is nearly 20k deaths.
fig = plt.figure(figsize=(10,5),facecolor='1')
plt.title("Male Death Age in Malaysia")


sns.barplot(data=df, x='age_group',y='male_death_age',palette='mako')
plt.xticks(rotation=90)
plt.show()
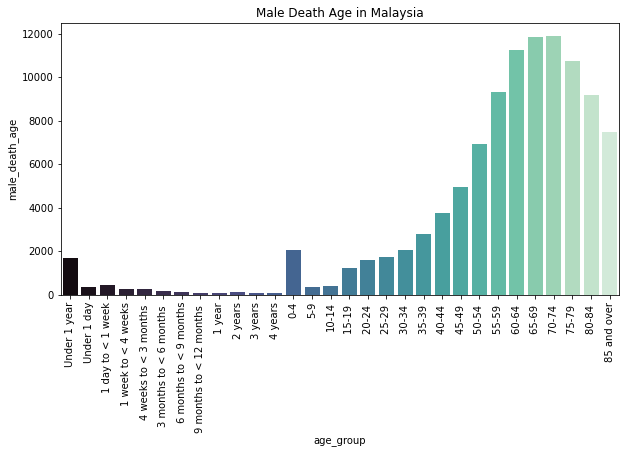
Description: From the graph, we can see the distribution of death count of males by age group in Malaysia. From the graph, we can see that men in Malaysia mostly died at the age 70-74 which is nearly 12k deaths.
fig = plt.figure(figsize=(10,5),facecolor='1')
plt.title("Female Death Age in Malaysia")


sns.barplot(data=df, x='age_group',y='female_death_age',palette='plasma')
plt.xticks(rotation=90)
plt.show()
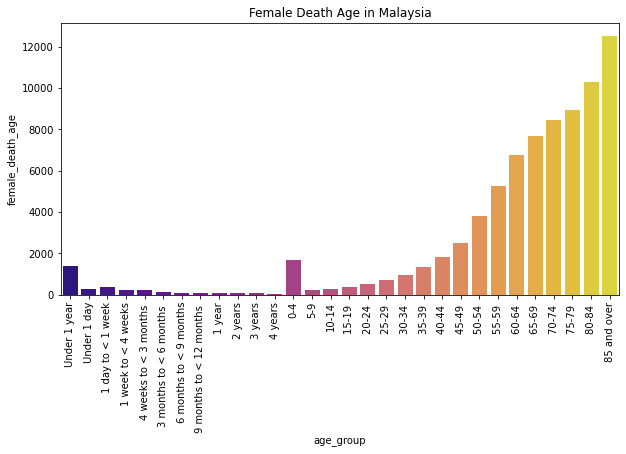
Description: From the graph, we can see the distribution of death count of females by age group in Malaysia. From the graph, we can see that women in Malaysia mostly died at the age 85 and over which is more than 12k deaths.
max_male_age = df.loc[df.male_death_age == df.male_death_age.max(), 'age_group'].values[0]
max_female_age = df.loc[df.female_death_age == df.female_death_age.max(), 'age_group'].values[0]

print('Most male in Malaysia died between '+max_male_age)
print('Most female in Malaysia died between '+max_female_age)
Most male in Malaysia died between 70-74
Most female in Malaysia died between 85 and over
df['male_death_sum']=df['male_death_age'].sum()
df['female_death_sum']=df['female_death_age'].sum()
fig = plt.figure(figsize=(10,5),facecolor='1')
plt.title("Death age by gender in Malaysia")
sns.barplot('age_group', 'value', hue='variable', palette='mako',
             data=pd.melt(df[['male_death_age','female_death_age','age_group']], 'age_group'))
plt.xticks(rotation=90)
plt.show()
C:\Users\Haziq\Anaconda3\lib\site-packages\seaborn\_decorators.py:36: FutureWarning: Pass the following variables as keyword args: x, y. From version 0.12, the only valid positional argument will be `data`, and passing other arguments without an explicit keyword will result in an error or misinterpretation.
  warnings.warn(
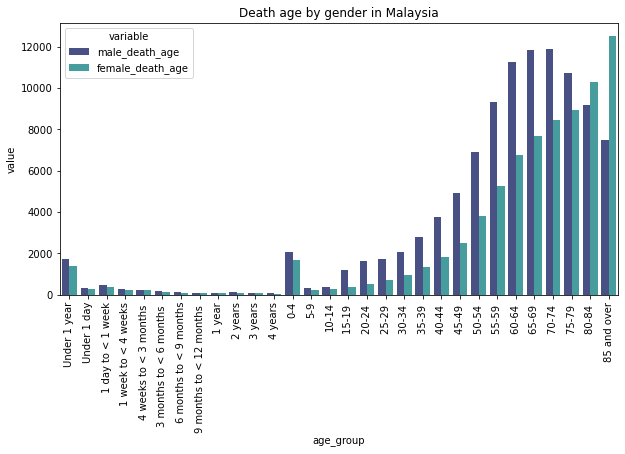
Description: From the graph, we can see the comparison of death count of females and males by age group in Malaysia. From the graph, we can see that more men died and live shorter in comparison women in Malaysia.
Death by gender in 2019
df = pd.read_csv('cleaned_data/death_causes_2019.csv')
df.tail()
| death_cause | death_count | percentage | certification | |
|---|---|---|---|---|
| 15 | Ischaemic heart diseases | 1023 | 1.584033 | non-medical |
| 16 | Trachea, bronchus and lung cancer | 742 | 1.148927 | non-medical |
| 17 | Colon, rectum and anus cancer | 715 | 1.107120 | non-medical |
| 18 | Liver cancer | 533 | 0.825307 | non-medical |
| 19 | Breast cancer | 524 | 0.811372 | non-medical |
fig = plt.figure(figsize=(10,5),facecolor='1')
plt.title("Death causes by medical certification in Malaysia")
sns.barplot(data=df, x='death_count',y='death_cause',hue='certification',palette='mako')
plt.xticks(rotation=0)
plt.show()
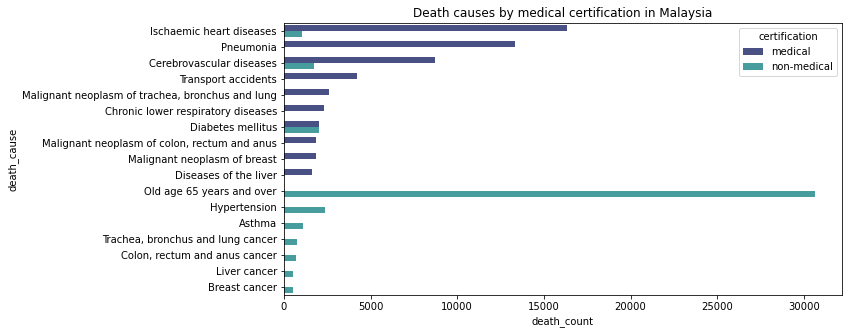
Description: The bar chart shows the major cause of death in Malaysia, grouped into medical and non-medical certified cases. Here, we can see that most of the medically certified death is caused by isochaemic heart diseases. Old age 65 years and over is the most non-medically certified death in Malaysia.
df_med = df[df['certification']=='medical']
df_nmed = df[df['certification']=='non-medical']
df_nmed
| death_cause | death_count | percentage | certification | |
|---|---|---|---|---|
| 10 | Old age 65 years and over | 30665 | 47.482271 | non-medical |
| 11 | Hypertension | 2393 | 3.705367 | non-medical |
| 12 | Diabetes mellitus | 1997 | 3.092193 | non-medical |
| 13 | Cerebrovascular diseases | 1708 | 2.644700 | non-medical |
| 14 | Asthma | 1076 | 1.664550 | non-medical |
| 15 | Ischaemic heart diseases | 1023 | 1.584033 | non-medical |
| 16 | Trachea, bronchus and lung cancer | 742 | 1.148927 | non-medical |
| 17 | Colon, rectum and anus cancer | 715 | 1.107120 | non-medical |
| 18 | Liver cancer | 533 | 0.825307 | non-medical |
| 19 | Breast cancer | 524 | 0.811372 | non-medical |
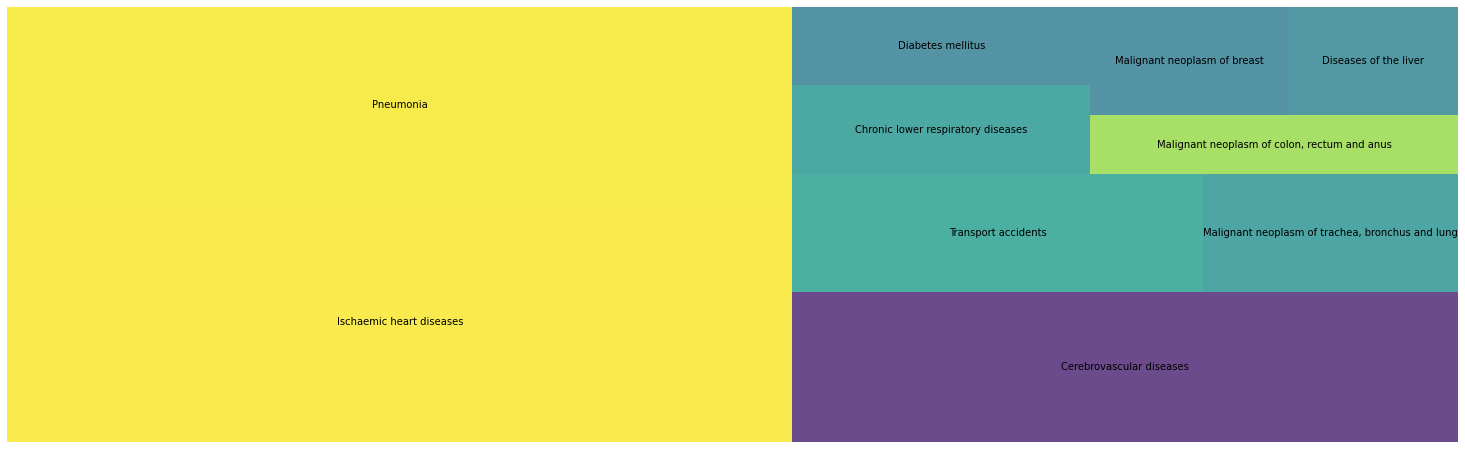
import squarify

df_med.sort_values('death_count', ascending=False, inplace=True)

fig, ax = plt.subplots(1, figsize = (26,8))
squarify.plot(sizes=df_med['death_count'],
                label=df_med['death_cause'][:10],
                alpha=.8)
plt.axis('off')
plt.show()
<ipython-input-253-49e775037926>:3: SettingWithCopyWarning:
A value is trying to be set on a copy of a slice from a DataFrame

See the caveats in the documentation: https://pandas.pydata.org/pandas-docs/stable/user_guide/indexing.html#returning-a-view-versus-a-copy
  df_med.sort_values('death_count', ascending=False, inplace=True)
import squarify

df_nmed.sort_values('death_count', ascending=False, inplace=True)

fig, ax = plt.subplots(1, figsize = (26,8))
squarify.plot(sizes=df_nmed['death_count'],
                label=df_nmed['death_cause'][:10],
                alpha=.8)
plt.axis('off')
plt.show()
<ipython-input-254-61ce348f60b8>:3: SettingWithCopyWarning:
A value is trying to be set on a copy of a slice from a DataFrame

See the caveats in the documentation: https://pandas.pydata.org/pandas-docs/stable/user_guide/indexing.html#returning-a-view-versus-a-copy
  df_nmed.sort_values('death_count', ascending=False, inplace=True)

Death by state in 2019
df = pd.read_csv('cleaned_data/death_rate_by_state_and_sex_2019.csv')
df.head()
| state_death | total_death | male_death | female_death | total_death_rate | male_death_rate | female_death_rate | |
|---|---|---|---|---|---|---|---|
| 0 | Johor | 21776 | 12743 | 9033 | 5.789692 | 6.453459 | 5.056066 |
| 1 | Kedah | 14292 | 8027 | 6265 | 6.574828 | 7.287441 | 5.842794 |
| 2 | Kelantan | 11389 | 6436 | 4953 | 6.045617 | 6.759489 | 5.316083 |
| 3 | Melaka | 5542 | 3084 | 2458 | 5.969410 | 6.619759 | 5.314342 |
| 4 | Negeri Sembilan | 7157 | 4097 | 3060 | 6.355022 | 7.056639 | 5.608422 |
fig = plt.figure(figsize=(10,5),facecolor='1')
plt.title(r"Death age by state and gender in Malaysia (2019)")
sns.barplot('state_death', 'value', hue='variable', palette='mako',
             data=pd.melt(df[['male_death','female_death','state_death']], 'state_death'))
plt.xticks(rotation=50)
plt.show()
C:\Users\Haziq\Anaconda3\lib\site-packages\seaborn\_decorators.py:36: FutureWarning: Pass the following variables as keyword args: x, y. From version 0.12, the only valid positional argument will be `data`, and passing other arguments without an explicit keyword will result in an error or misinterpretation.
  warnings.warn(
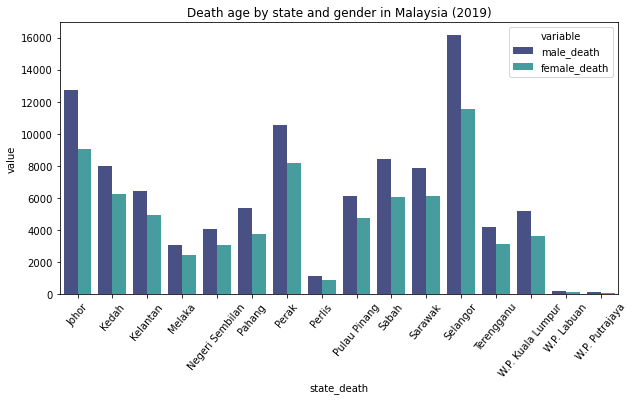
Description: From the chart, we can se that Selangor recorded the most death cases in Malaysia.In contrast, W.P. Putrajaya recorded the least death case. Overall, we can see that all of the states recorded more death for men than women.
fig = plt.figure(figsize=(10,5),facecolor='1')
plt.title(r"Death rate per 1000 people by state and gender in Malaysia (2019)")

sns.barplot('state_death', 'value', hue='variable', palette='mako',
             data=pd.melt(df[['male_death_rate','female_death_rate','total_death_rate','state_death']], 'state_death'))
plt.xticks(rotation=50)
plt.show()
C:\Users\Haziq\Anaconda3\lib\site-packages\seaborn\_decorators.py:36: FutureWarning: Pass the following variables as keyword args: x, y. From version 0.12, the only valid positional argument will be `data`, and passing other arguments without an explicit keyword will result in an error or misinterpretation.
  warnings.warn(
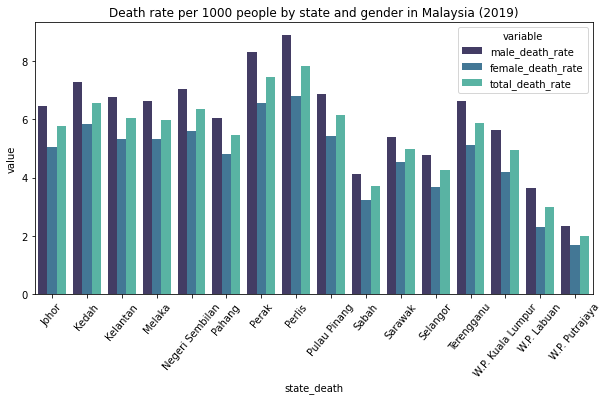
Description: The bar chart shows the death rate per 1000 people by state and gender in Malaysia. Here, we can see that Perlis recorded the highest total death rate for both gender in Malaysia. In contrast, W.P. Putrajaya have the lowest death rate for both genders. For all of the states, we can see that men have a higher death rate than women.