
The extraordinary 2020 Summer Olympics will take place without fans or spectators and under a state of emergency due to the coronavirus pandemic, after a 12-month delay. But nevertheless, even without the any fans at the stadium, there are still words of support from all around the world at the palms of our hand. But are the Tweets truly supportive, or filled with hate comments? Let’s find out.
1. Questions
This analysis will try to answer the following questions:
- What are the people’s reactions on Twitter about the 2020 Summer Olympics Tokyo?
- Are the Tweets posted are about their opinions or stating a fact?
- What are the Tweets mostly talk about?
2. Measurement Priorities
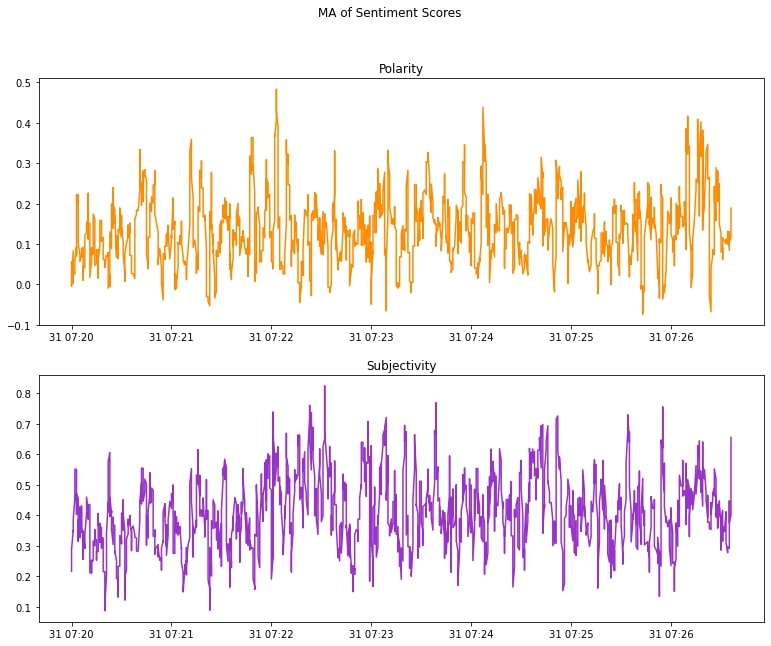
- The polarity of the Tweets by analyzing the sentiment’s polarity score.
- The subjectivity of the Tweets by analyzing the subjectivity score of the sentiments.
- Creating a collection of words for each group of sentiments using word clouds.
3. Data Collection
- Source
- The Tweets collected will be from Twitter.com using their API.
- The python library Tweepy will be used to gather the Tweets.
- The Tweets collected will be the posts tagged with #Tokyo2020.
- Storage
- The collected Tweets will be stored in a CSV and TXT file.
- The cleaned Tweets will also be stored as both CSV and TXT file.
Github link for project
Importing main libraries
import numpy as np
import pandas as pd
import matplotlib.pyplot as plt
import seaborn as sns
#Setting Up Tweepy to use Twitter API
Twitter Authentication
import tweepy as tw
#authentication information.
consumer_key ='*********'
consumer_secret='*********'
access_token='*********'
access_token_secret='**********'
#Authentication
auth=tw.OAuthHandler(consumer_key,consumer_secret)
auth.set_access_token(access_token,access_token_secret)
api=tw.API(auth,wait_on_rate_limit=True)
Collect Tweets
 #fetch tweets

 hashtag = '#Tokyo2020'
 query = tw.Cursor(api.search,q=hashtag, lang='en').items(2000)
 tweets = [{'Tweets':tweet.text,'Timestamp':tweet.created_at} for tweet in query]
 print(tweets)
#create a copy of the raw data
tweet=tweets.copy()
#store as DataFrame
data=pd.DataFrame.from_dict(tweet)
data.head()
Export Collected Data
data.to_csv(r'/original/tokyo2020all.csv', index = False)
data.to_csv(r'/original/tokyo2020all.txt', index = False)
Load Exported data to Data Frame
text_data='original/tokyo2020all.txt'
data_txt = pd.read_csv(text_data)
data_txt.shape
(2000, 2)
df=data_txt.copy()
df.head()
| Tweets | Timestamp | |
|---|---|---|
| 0 | RT @stadiumastro: NUR DHABITAH IS THROUGH TO T... | 2021-07-31 07:26:36 |
| 1 | Limerick is incredibly proud of @sarahlavin_ 🏃... | 2021-07-31 07:26:36 |
| 2 | RT @stadiumastro: NUR DHABITAH IS THROUGH TO T... | 2021-07-31 07:26:36 |
| 3 | RT @Ra_THORe: Amazing performance! \n#Kamalpre... | 2021-07-31 07:26:36 |
| 4 | RT @BadmintonTalk: INDONESIA #INA Men's Single... | 2021-07-31 07:26:36 |
EDA
Data Shape
eda = df.copy()
eda.shape
(2000, 2)
Data Types and Null count
eda.info()
<class 'pandas.core.frame.DataFrame'>
RangeIndex: 2000 entries, 0 to 1999
Data columns (total 2 columns):
 #   Column     Non-Null Count  Dtype
---  ------     --------------  -----
 0   Tweets     2000 non-null   object
 1   Timestamp  2000 non-null   object
dtypes: object(2)
memory usage: 31.4+ KB
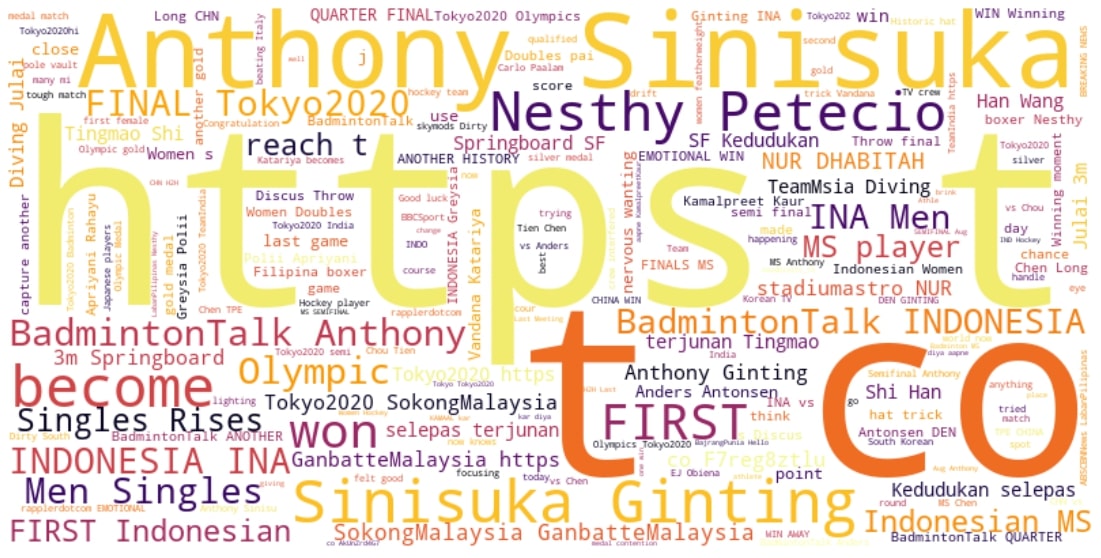
Scraped Tweets WordCloud
from wordcloud import WordCloud, STOPWORDS, ImageColorGenerator
# Text of all words in column Tweets

text = " ".join(review for review in eda.Tweets.astype(str))
print ("There are {} words in the combination of all cells in column Tweets.".format(len(text)))

# Create stopword list:
# remove words that we want to exclude

stopwords = set(STOPWORDS)
stopwords.update(['RT','#F9'])

# Generate a word cloud image

wordcloud = WordCloud(stopwords=stopwords, background_color="white", width=800, height=400,colormap='inferno').generate(text)

# Display the generated image:
# the matplotlib way:

fig=plt.figure(figsize=(20,10))
plt.tight_layout(pad=0)
plt.axis("off")
plt.imshow(wordcloud, interpolation='bilinear')
plt.show()
There are 270852 words in the combination of all cells in column Tweets.
Language Detection
from langdetect import detect

lang = detect(text)

print(lang)
en
Data Preprocessing
df_cleaning=df.copy()
df_cleaning.head()
| Tweets | Timestamp | |
|---|---|---|
| 0 | RT @stadiumastro: NUR DHABITAH IS THROUGH TO T... | 2021-07-31 07:26:36 |
| 1 | Limerick is incredibly proud of @sarahlavin_ 🏃... | 2021-07-31 07:26:36 |
| 2 | RT @stadiumastro: NUR DHABITAH IS THROUGH TO T... | 2021-07-31 07:26:36 |
| 3 | RT @Ra_THORe: Amazing performance! \n#Kamalpre... | 2021-07-31 07:26:36 |
| 4 | RT @BadmintonTalk: INDONESIA #INA Men's Single... | 2021-07-31 07:26:36 |
Removing Hashtags and Mentions
import re
def cleaning_hash_mentions(data):
    return re.sub("((#[A-Za-z0-9]+)|(@[A-Za-z0-9]+))",' ',data)

df_cleaning['tweets_no_tags'] = df_cleaning['Tweets'].apply(lambda x: cleaning_hash_mentions(x))
Removing URLs
#remove URLs
import re
def cleaning_URLs(data):
    return re.sub('((www.[^s]+)|(https?://[^s]+))',' ',data)

df_cleaning['tweets_no_url'] = df_cleaning['tweets_no_tags'].apply(lambda x: cleaning_URLs(x))
Removing Numbers
#remove numbers
def cleaning_numbers(data):
    return re.sub('[0-9]+', '', data)
df_cleaning['tweets_no_num'] = df_cleaning['tweets_no_url'].apply(lambda x: cleaning_numbers(x))
Set to Lower Case
# Lower case all words
df_cleaning['tweets_lower'] = df_cleaning['tweets_no_num'].apply(lambda x: " ".join(x.lower() for x in x.split()))
Removing Punctuations
# Remove Punctuation
df_cleaning['tweets_nopunc'] = df_cleaning['tweets_lower'].str.replace('[^\w\s]', '')
<ipython-input-19-92b1699700d6>:2: FutureWarning: The default value of regex will change from True to False in a future version.
  df_cleaning['tweets_nopunc'] = df_cleaning['tweets_lower'].str.replace('[^\w\s]', '')
Removing Stopwords
# Import stopwords
import nltk
from nltk.corpus import stopwords
nltk.download('stopwords')
stop_words = stopwords.words('english')

# Remove Stopwords
df_cleaning['tweets_nopunc_nostop'] = df_cleaning['tweets_nopunc'].apply(lambda x: " ".join(x for x in x.split() if x not in stop_words))
[nltk_data] Downloading package stopwords to
[nltk_data]     C:\Users\Haziq\AppData\Roaming\nltk_data...
[nltk_data]   Package stopwords is already up-to-date!
# Return frequency of values
freq= pd.Series(" ".join(df_cleaning['tweets_nopunc_nostop']).split()).value_counts()[:30]
freq
rt             1821
anthony         376
ginting         362
first           321
womens          265
win             242
ms              231
gold            223
sinisuka        218
finals          200
final           199
nesthy          196
become          195
indonesia       193
indonesian      185
petecio         185
medal           184
mens            181
player          180
dhabitah        139
olympic         137
singles         133
reach           131
game            130
another         129
rises           128
nur             127
springboard     117
last            116
vs              113
dtype: int64
other_stopwords = ['rt', 'tokyo2020', 'reach','ganbattemalaysia','badmintontalk','sokongmalaysia']
df_cleaning['tweets_nopunc_nostop_nocommon'] = df_cleaning['tweets_nopunc_nostop'].apply(lambda x: "".join(" ".join(x for x in x.split() if x not in other_stopwords)))
Lemmatization
# Import textblob
from textblob import Word
nltk.download('wordnet')

# Lemmatize final review format
df_cleaning['cleaned_tweets'] = df_cleaning['tweets_nopunc_nostop_nocommon']\
.apply(lambda x: " ".join([Word(word).lemmatize() for word in x.split()]))
[nltk_data] Downloading package wordnet to
[nltk_data]     C:\Users\Haziq\AppData\Roaming\nltk_data...
[nltk_data]   Package wordnet is already up-to-date!
Output from Preprocessing
df_cleaning.head()
| Tweets | Timestamp | tweets_no_tags | tweets_no_url | tweets_no_num | tweets_lower | tweets_nopunc | tweets_nopunc_nostop | tweets_nopunc_nostop_nocommon | cleaned_tweets | |
|---|---|---|---|---|---|---|---|---|---|---|
| 0 | RT @stadiumastro: NUR DHABITAH IS THROUGH TO T... | 2021-07-31 07:26:36 | RT : NUR DHABITAH IS THROUGH TO THE FINAL!\n\... | RT : NUR DHABITAH IS THROUGH TO THE FINAL!\n\... | RT : NUR DHABITAH IS THROUGH TO THE FINAL!\n\... | rt : nur dhabitah is through to the final! | rt nur dhabitah is through to the final | rt nur dhabitah final | nur dhabitah final | nur dhabitah final |
| 1 | Limerick is incredibly proud of @sarahlavin_ 🏃... | 2021-07-31 07:26:36 | Limerick is incredibly proud of _ 🏃♀️ She is... | Limerick is incredibly proud of _ 🏃♀️ She is... | Limerick is incredibly proud of _ 🏃♀️ She is... | limerick is incredibly proud of _ 🏃♀️ she is ... | limerick is incredibly proud of _ she is a ph... | limerick incredibly proud _ phenomenal athlete... | limerick incredibly proud _ phenomenal athlete... | limerick incredibly proud _ phenomenal athlete... |
| 2 | RT @stadiumastro: NUR DHABITAH IS THROUGH TO T... | 2021-07-31 07:26:36 | RT : NUR DHABITAH IS THROUGH TO THE FINAL!\n\... | RT : NUR DHABITAH IS THROUGH TO THE FINAL!\n\... | RT : NUR DHABITAH IS THROUGH TO THE FINAL!\n\... | rt : nur dhabitah is through to the final! | rt nur dhabitah is through to the final | rt nur dhabitah final | nur dhabitah final | nur dhabitah final |
| 3 | RT @Ra_THORe: Amazing performance! \n#Kamalpre... | 2021-07-31 07:26:36 | RT _THORe: Amazing performance! \n advances ... | RT _THORe: Amazing performance! \n advances ... | RT _THORe: Amazing performance! \n advances ... | rt _thore: amazing performance! advances to wo... | rt _thore amazing performance advances to wome... | rt _thore amazing performance advances womens ... | _thore amazing performance advances womens dis... | _thore amazing performance advance woman discu... |
| 4 | RT @BadmintonTalk: INDONESIA #INA Men's Single... | 2021-07-31 07:26:36 | RT : INDONESIA Men's Singles Rises Again!\n... | RT : INDONESIA Men's Singles Rises Again!\n... | RT : INDONESIA Men's Singles Rises Again!\n... | rt : indonesia men's singles rises again! anth... | rt indonesia mens singles rises again anthony... | rt indonesia mens singles rises anthony sinisu... | indonesia mens singles rises anthony sinisuka ... | indonesia men single rise anthony sinisuka gin... |
Convert Tweet Time Object to Timestamp
df_cleaning['Timestamp'] = pd.to_datetime(df_cleaning['Timestamp'])
df_cleaning.dtypes
Tweets                                   object
Timestamp                        datetime64[ns]
tweets_no_tags                           object
tweets_no_url                            object
tweets_no_num                            object
tweets_lower                             object
tweets_nopunc                            object
tweets_nopunc_nostop                     object
tweets_nopunc_nostop_nocommon            object
cleaned_tweets                           object
dtype: object
df_cleaned= df_cleaning[["cleaned_tweets","Timestamp"]]
df_cleaned.head()
| cleaned_tweets | Timestamp | |
|---|---|---|
| 0 | nur dhabitah final | 2021-07-31 07:26:36 |
| 1 | limerick incredibly proud _ phenomenal athlete... | 2021-07-31 07:26:36 |
| 2 | nur dhabitah final | 2021-07-31 07:26:36 |
| 3 | _thore amazing performance advance woman discu... | 2021-07-31 07:26:36 |
| 4 | indonesia men single rise anthony sinisuka gin... | 2021-07-31 07:26:36 |
Export Cleaned Data
df_cleaned.to_csv('cleaned/tokyo2020_cleaned.csv', index = False)
df_cleaned.to_csv('cleaned/tokyo2020_cleaned.txt', index = False)
Sentiment Analysis
df_sa=df_cleaned.copy()
# Calculate polarity and subjectivity
from textblob import TextBlob
df_sa['polarity'] = df_sa['cleaned_tweets'].apply(lambda x: TextBlob(x).sentiment[0])
df_sa['subjectivity'] = df_sa['cleaned_tweets'].apply(lambda x: TextBlob(x).sentiment[1])
df_sa.head()
| cleaned_tweets | Timestamp | polarity | subjectivity | |
|---|---|---|---|---|
| 0 | nur dhabitah final | 2021-07-31 07:26:36 | 0.000000 | 1.00000 |
| 1 | limerick incredibly proud _ phenomenal athlete... | 2021-07-31 07:26:36 | 0.650000 | 0.75000 |
| 2 | nur dhabitah final | 2021-07-31 07:26:36 | 0.000000 | 1.00000 |
| 3 | _thore amazing performance advance woman discu... | 2021-07-31 07:26:36 | 0.300000 | 0.95000 |
| 4 | indonesia men single rise anthony sinisuka gin... | 2021-07-31 07:26:36 | 0.089286 | 0.27381 |
Polarity Label
df_label = df_sa.copy()
def polar_label(polar):
  if polar<0:
    return "negative"
  elif polar==0:
    return "neutral"
  else:
    return "positive"

df_label['polar_label'] = df_label['polarity'].apply(lambda x: polar_label(x))
def subj_label(subj):
  if subj<0.5:
    return "objective"
  elif subj==0.5:
    return "neutral"
  else:
    return "subjective"

df_label['subj_label'] = df_label['subjectivity'].apply(lambda x: subj_label(x))
df_label[['cleaned_tweets','polarity', 'subjectivity','polar_label','subj_label']].head()
| cleaned_tweets | polarity | subjectivity | polar_label | subj_label | |
|---|---|---|---|---|---|
| 0 | nur dhabitah final | 0.000000 | 1.00000 | neutral | subjective |
| 1 | limerick incredibly proud _ phenomenal athlete... | 0.650000 | 0.75000 | positive | subjective |
| 2 | nur dhabitah final | 0.000000 | 1.00000 | neutral | subjective |
| 3 | _thore amazing performance advance woman discu... | 0.300000 | 0.95000 | positive | subjective |
| 4 | indonesia men single rise anthony sinisuka gin... | 0.089286 | 0.27381 | positive | objective |
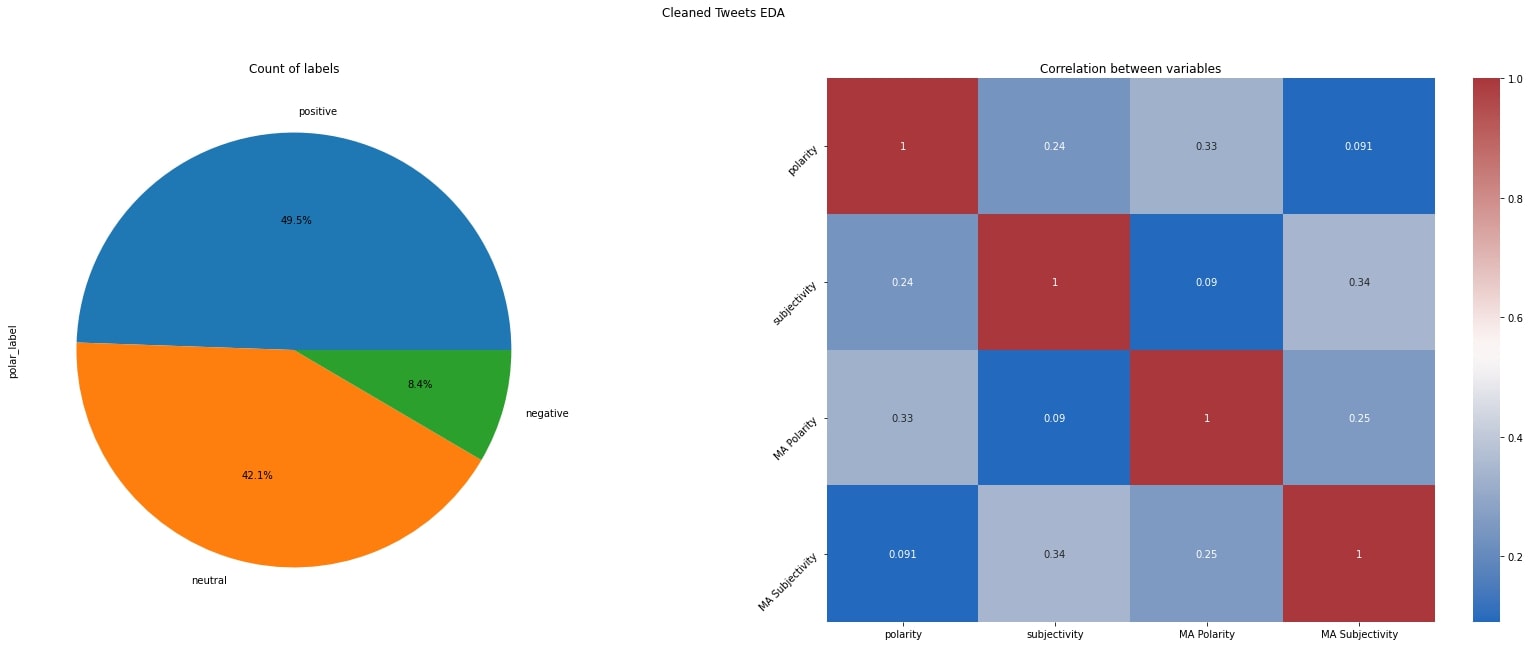
df_label['polar_label'].value_counts()
positive    989
neutral     842
negative    169
Name: polar_label, dtype: int64
df_label['subj_label'].value_counts()
objective     1226
subjective     719
neutral         55
Name: subj_label, dtype: int64
df_label.isna().sum()
cleaned_tweets    0
Timestamp         0
polarity          0
subjectivity      0
polar_label       0
subj_label        0
dtype: int64
Polarity & Subjectivity Score
df_label[['polarity','subjectivity']].describe()
| polarity | subjectivity | |
|---|---|---|
| count | 2000.000000 | 2000.000000 |
| mean | 0.134933 | 0.413012 |
| std | 0.250944 | 0.354464 |
| min | -1.000000 | 0.000000 |
| 25% | 0.000000 | 0.000000 |
| 50% | 0.000000 | 0.333333 |
| 75% | 0.250000 | 0.650000 |
| max | 1.000000 | 1.000000 |
Visualization
Moving Averages
df_vis = df_label.copy()
df_mov_avg = df_vis[['Timestamp', 'polarity','subjectivity']]
df_mov_avg = df_mov_avg.sort_values(by='Timestamp', ascending=True)
df_mov_avg['MA Polarity'] = df_mov_avg.polarity.rolling(10, min_periods=3).mean()
df_mov_avg['MA Subjectivity'] = df_mov_avg.subjectivity.rolling(10, min_periods=3).mean()
df_mov_avg.tail()
| Timestamp | polarity | subjectivity | MA Polarity | MA Subjectivity | |
|---|---|---|---|---|---|
| 4 | 2021-07-31 07:26:36 | 0.089286 | 0.27381 | 0.116323 | 0.401171 |
| 3 | 2021-07-31 07:26:36 | 0.300000 | 0.95000 | 0.146323 | 0.496171 |
| 2 | 2021-07-31 07:26:36 | 0.000000 | 1.00000 | 0.133823 | 0.579504 |
| 1 | 2021-07-31 07:26:36 | 0.650000 | 0.75000 | 0.155489 | 0.594504 |
| 0 | 2021-07-31 07:26:36 | 0.000000 | 1.00000 | 0.188823 | 0.654504 |
df_mov_avg.dtypes
Timestamp          datetime64[ns]
polarity                  float64
subjectivity              float64
MA Polarity               float64
MA Subjectivity           float64
dtype: object
fig, axes = plt.subplots(2, 1, figsize=(13, 10))

axes[0].plot(df_mov_avg['Timestamp'], df_mov_avg['MA Polarity'], color='darkorange')
axes[0].set_title("\n".join(["Polarity"]))
axes[1].plot(df_mov_avg['Timestamp'], df_mov_avg['MA Subjectivity'], color='darkorchid')
axes[1].set_title("\n".join(["Subjectivity"]))


fig.suptitle("\n".join(["MA of Sentiment Scores"]), y=0.98)
plt.show()
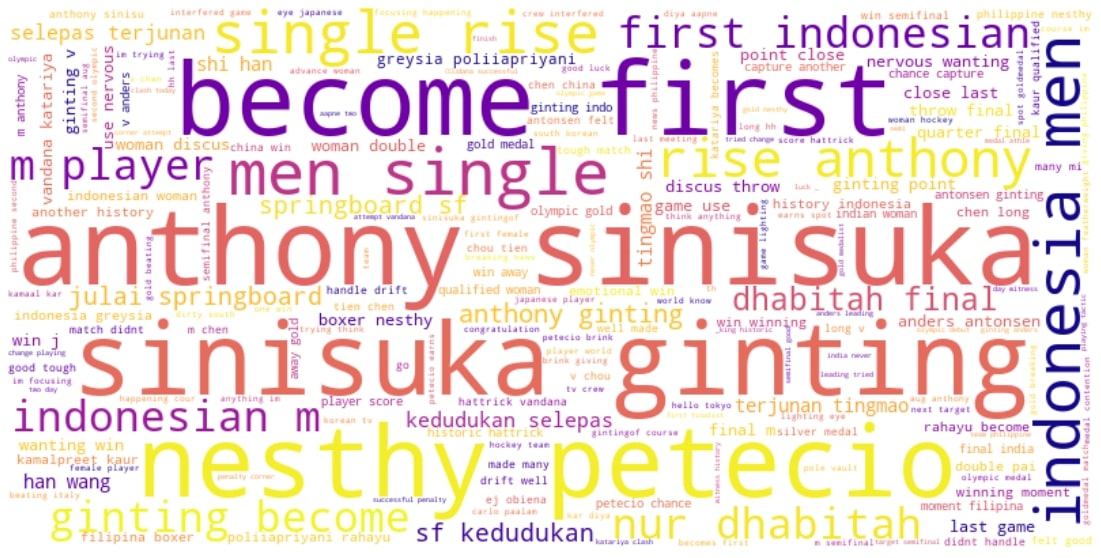
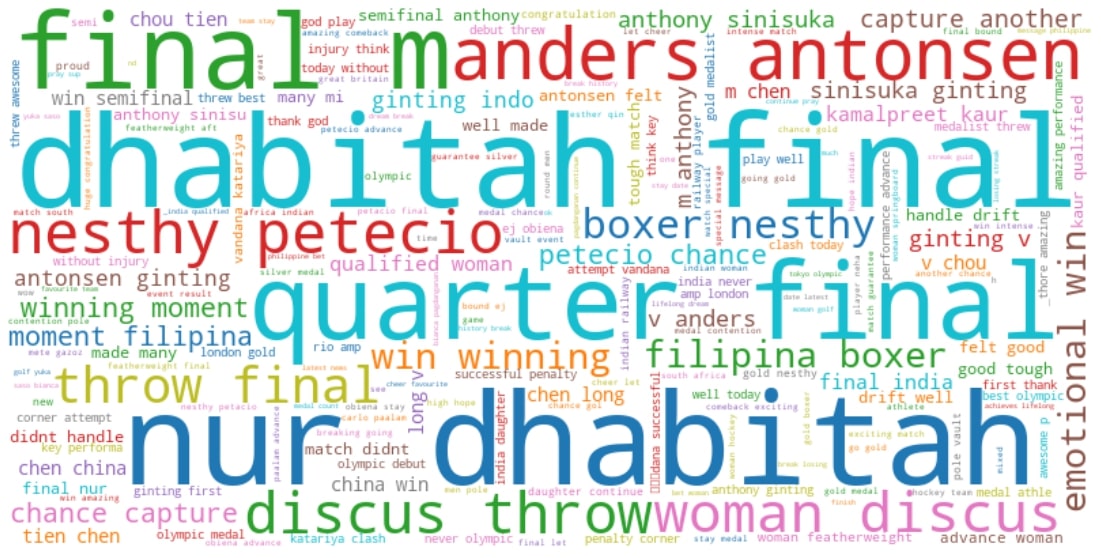
Cleaned Tweets WordCloud
# Text of all words in column Tweets

text = " ".join(review for review in df_cleaned.cleaned_tweets.astype(str))
print ("There are {} words in the combination of all cells in column Tweets.".format(len(text)))

# Create stopword list:
# remove words that we want to exclude

stopwords = set(STOPWORDS)

# Generate a word cloud image

wordcloud = WordCloud(stopwords=stopwords, background_color="white", width=800, height=400,colormap='plasma').generate(text)

# Display the generated image:
# the matplotlib way:

fig=plt.figure(figsize=(20,10))
plt.tight_layout(pad=0)
plt.axis("off")
plt.imshow(wordcloud, interpolation='bilinear')
plt.show()
There are 130215 words in the combination of all cells in column Tweets.
Positive Tweets WordCloud
df_pos = df_vis[df_vis['polar_label']=='positive']

# Text of all words in column Tweets

text = " ".join(review for review in df_pos.cleaned_tweets.astype(str))
print ("There are {} words in the combination of all cells in column Tweets.".format(len(text)))

# Create stopword list:
# remove words that we want to exclude

stopwords = set(STOPWORDS)

# Generate a word cloud image

wordcloud = WordCloud(stopwords=stopwords, background_color="white", width=800, height=400,colormap='inferno').generate(text)

# Display the generated image:
# the matplotlib way:

fig=plt.figure(figsize=(20,10))
plt.tight_layout(pad=0)
plt.axis("off")
plt.imshow(wordcloud, interpolation='bilinear')
plt.show()
There are 72234 words in the combination of all cells in column Tweets.

Negative Tweets WordCloud
df_neg = df_vis[df_vis['polar_label']=='negative']

# Text of all words in column Tweets

text = " ".join(review for review in df_neg.cleaned_tweets.astype(str))
print ("There are {} words in the combination of all cells in column Tweets.".format(len(text)))

# Create stopword list:
# remove words that we want to exclude

stopwords = set(STOPWORDS)

# Generate a word cloud image

wordcloud = WordCloud(stopwords=stopwords, background_color="white", width=800, height=400,colormap='tab10').generate(text)

# Display the generated image:
# the matplotlib way:

fig=plt.figure(figsize=(20,10))
plt.tight_layout(pad=0)
plt.axis("off")
plt.imshow(wordcloud, interpolation='bilinear')
plt.show()
There are 11599 words in the combination of all cells in column Tweets.

Objective Tweets WordCloud
df_obj = df_vis[df_vis['subj_label']=='objective']

# Text of all words in column Tweets

text = " ".join(review for review in df_obj.cleaned_tweets.astype(str))
print ("There are {} words in the combination of all cells in column Tweets.".format(len(text)))

# Create stopword list:
# remove words that we want to exclude

stopwords = set(STOPWORDS)

# Generate a word cloud image

wordcloud = WordCloud(stopwords=stopwords, background_color="white", width=800, height=400,colormap='tab10').generate(text)

# Display the generated image:
# the matplotlib way:

fig=plt.figure(figsize=(20,10))
plt.tight_layout(pad=0)
plt.axis("off")
plt.imshow(wordcloud, interpolation='bilinear')
plt.show()
There are 81725 words in the combination of all cells in column Tweets.
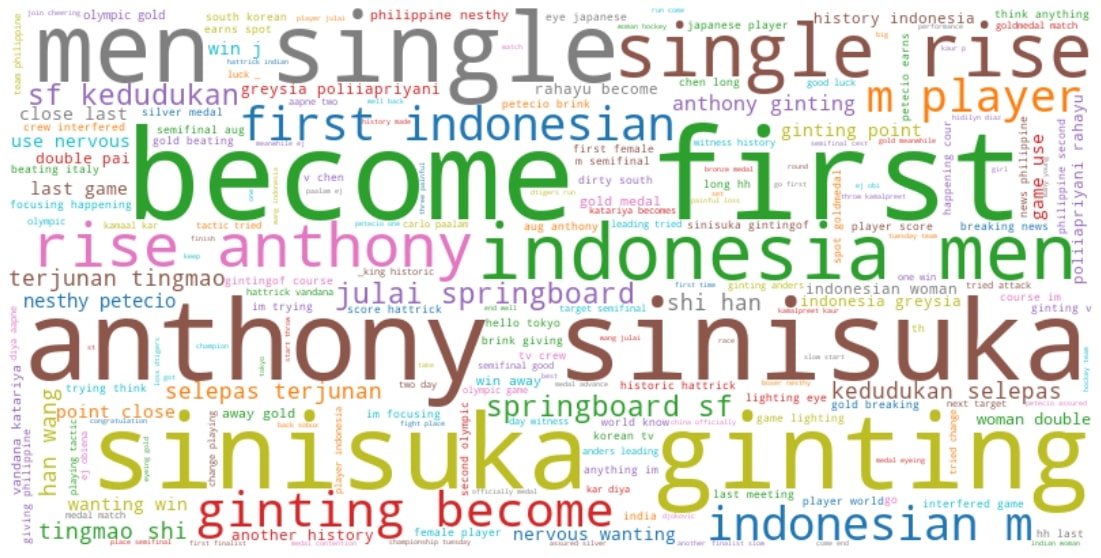
Subjective Tweets WordCloud
df_subj = df_vis[df_vis['subj_label']=='subjective']

# Text of all words in column Tweets

text = " ".join(review for review in df_subj.cleaned_tweets.astype(str))
print ("There are {} words in the combination of all cells in column Tweets.".format(len(text)))

# Create stopword list:
# remove words that we want to exclude

stopwords = set(STOPWORDS)

# Generate a word cloud image

wordcloud = WordCloud(stopwords=stopwords, background_color="white", width=800, height=400,colormap='tab10').generate(text)

# Display the generated image:
# the matplotlib way:

fig=plt.figure(figsize=(20,10))
plt.tight_layout(pad=0)
plt.axis("off")
plt.imshow(wordcloud, interpolation='bilinear')
plt.show()
There are 44634 words in the combination of all cells in column Tweets.
Label Count and Correlation Heatmap
import matplotlib.pyplot as plt
import seaborn as sns

fig, axs = plt.subplots(1,2)
plt.figure(figsize=(10,10))
fig.set_size_inches(30,10)

fig.suptitle('Cleaned Tweets EDA')
label_counts=df_vis['polar_label'].value_counts()
label_counts.plot(kind='pie',autopct='%1.1f%%',ax=axs[0])
axs[0].set_title("Count of labels")

corr = df_mov_avg.corr()
sns.heatmap(corr,ax=axs[1],annot=True,cmap="vlag")
axs[1].set_title("Correlation between variables")
axs[1].tick_params(labelrotation=45,axis='y')

plt.show()
<Figure size 720x720 with 0 Axes>
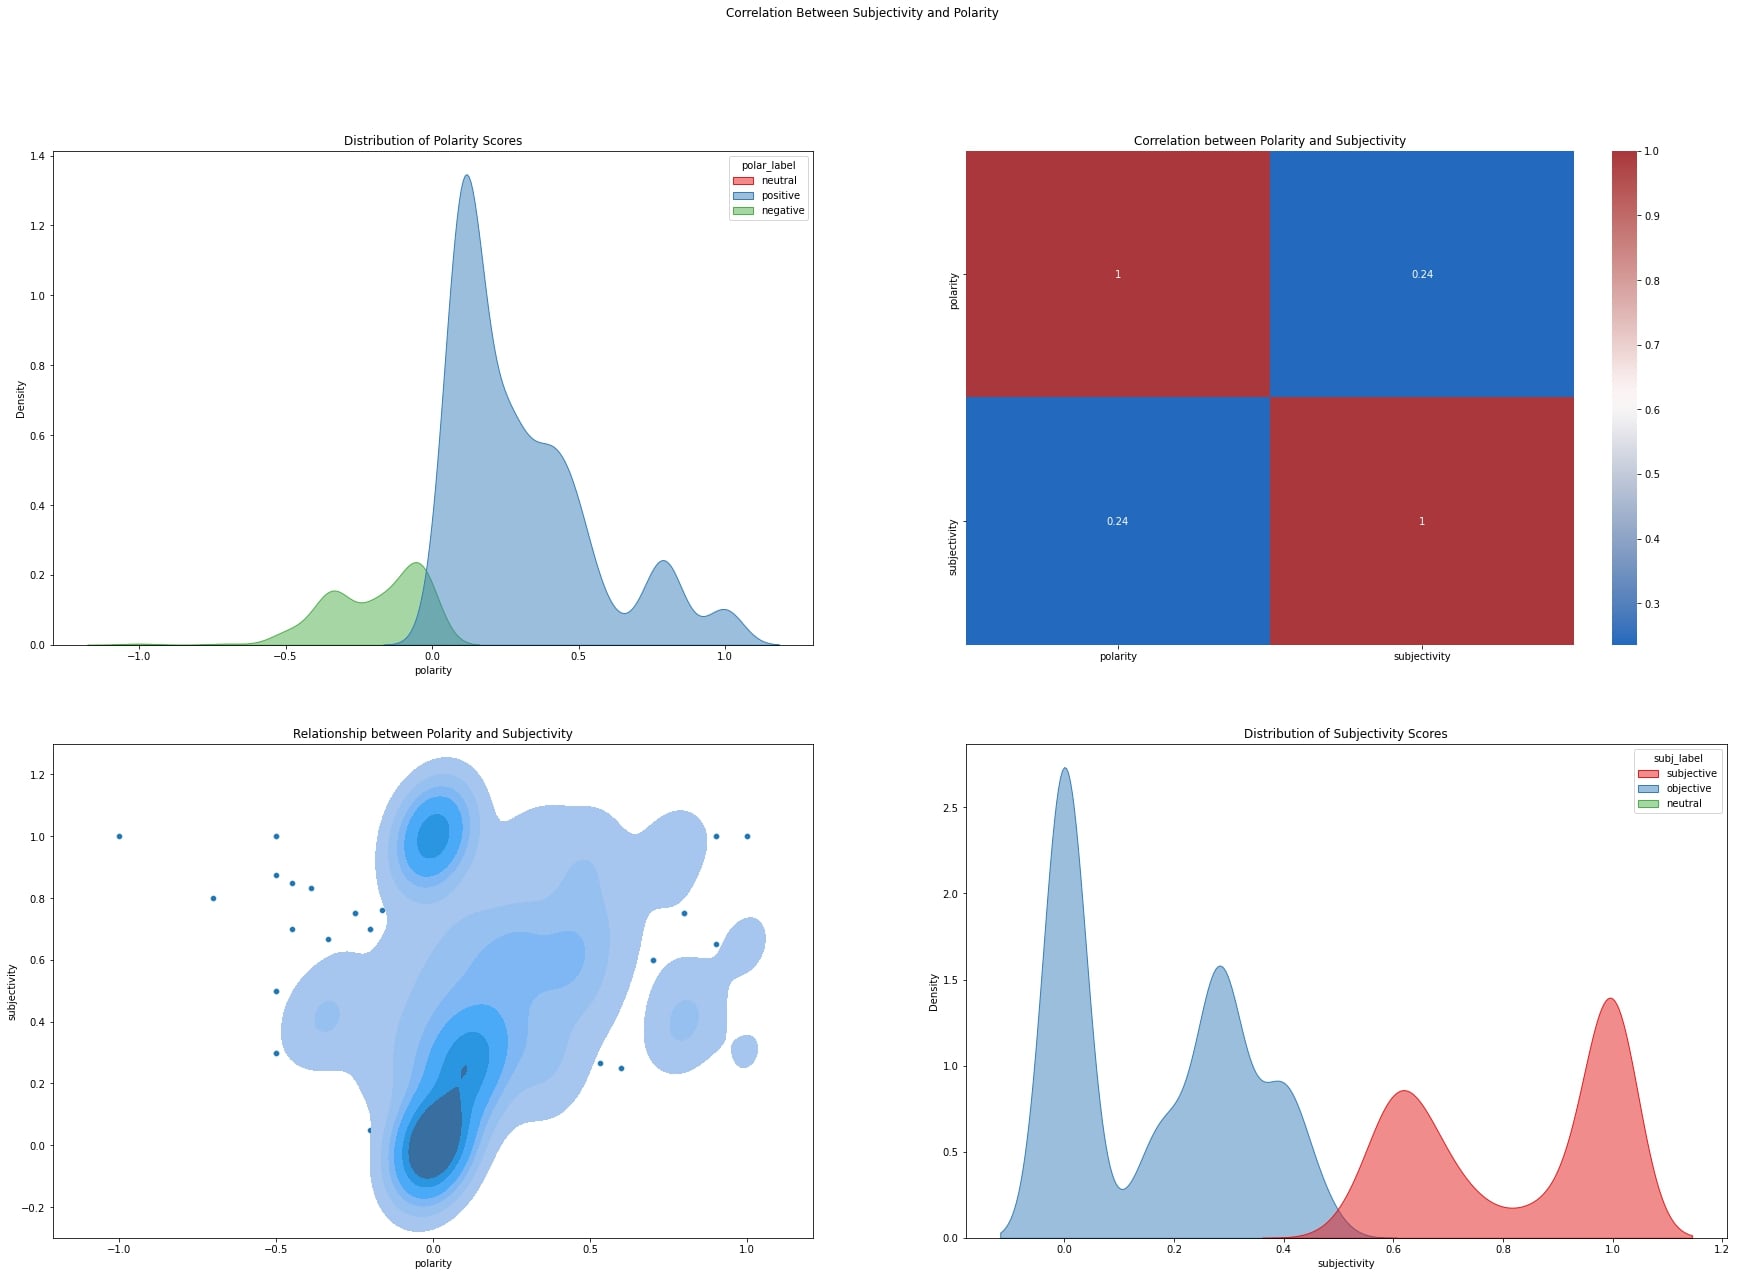
Correlation Between Polarity and Subjectivity
fig, axs = plt.subplots(2,2)
plt.figure(figsize=(10,10))
fig.set_size_inches(30,20)

fig.suptitle('Correlation Between Subjectivity and Polarity')

#polarity distribution
sns.kdeplot(
   data=df_vis, x="polarity", hue="polar_label",
   fill=True, palette="Set1",
   alpha=.5, linewidth=1,ax=axs[0,0]
)
axs[0,0].set_title("Distribution of Polarity Scores")

#correlation between polarity and subjectivity
corr_s_p = df_vis[['polarity','subjectivity']].corr()
sns.heatmap(corr_s_p,annot=True,cmap="vlag",ax=axs[0,1])
axs[0,1].set_title("Correlation between Polarity and Subjectivity")

#jointplot of subjectivity and polarity
sns.scatterplot(data=df_vis, x="polarity", y="subjectivity",ax=axs[1,0])
sns.kdeplot(data=df_vis, x="polarity", y="subjectivity", levels=7,
            linewidths=1,ax=axs[1,0],palette='mako',fill=True)
axs[1,0].set_title("Relationship between Polarity and Subjectivity")

#subjectivity distribution
sns.kdeplot(
   data=df_vis, x="subjectivity", hue="subj_label",
   fill=True, palette="Set1",
   alpha=.5, linewidth=1,ax=axs[1,1]
)
axs[1,1].set_title("Distribution of Subjectivity Scores")

plt.show()
C:\Users\Haziq\Anaconda3\lib\site-packages\seaborn\distributions.py:306: UserWarning: Dataset has 0 variance; skipping density estimate.
  warnings.warn(msg, UserWarning)
C:\Users\Haziq\Anaconda3\lib\site-packages\seaborn\distributions.py:1182: UserWarning: linewidths is ignored by contourf
  cset = contour_func(
C:\Users\Haziq\Anaconda3\lib\site-packages\seaborn\distributions.py:306: UserWarning: Dataset has 0 variance; skipping density estimate.
  warnings.warn(msg, UserWarning)
<Figure size 720x720 with 0 Axes>
Classification
Pre-Processing
Encoding the data
df_label.tail()
| cleaned_tweets | Timestamp | polarity | subjectivity | polar_label | subj_label | |
|---|---|---|---|---|---|---|
| 1995 | indonesia men single rise anthony sinisuka gin... | 2021-07-31 07:20:01 | 0.089286 | 0.273810 | positive | objective |
| 1996 | fight place semifinal cest srjdla | 2021-07-31 07:20:00 | 0.000000 | 0.000000 | neutral | objective |
| 1997 | little known village kabarwala thrower verg | 2021-07-31 07:20:00 | -0.187500 | 0.500000 | negative | neutral |
| 1998 | one win gold nesthy petecio fight woman feathe... | 2021-07-31 07:19:59 | 0.169444 | 0.647222 | positive | subjective |
| 1999 | hello tokyo | 2021-07-31 07:19:59 | 0.000000 | 0.000000 | neutral | objective |
df_class = df_label.copy()
df_class.tail()
| cleaned_tweets | Timestamp | polarity | subjectivity | polar_label | subj_label | |
|---|---|---|---|---|---|---|
| 1995 | indonesia men single rise anthony sinisuka gin... | 2021-07-31 07:20:01 | 0.089286 | 0.273810 | positive | objective |
| 1996 | fight place semifinal cest srjdla | 2021-07-31 07:20:00 | 0.000000 | 0.000000 | neutral | objective |
| 1997 | little known village kabarwala thrower verg | 2021-07-31 07:20:00 | -0.187500 | 0.500000 | negative | neutral |
| 1998 | one win gold nesthy petecio fight woman feathe... | 2021-07-31 07:19:59 | 0.169444 | 0.647222 | positive | subjective |
| 1999 | hello tokyo | 2021-07-31 07:19:59 | 0.000000 | 0.000000 | neutral | objective |
df_class['polar_label'] = pd.factorize(df_class['polar_label'])[0]
df_class['subj_label'] = pd.factorize(df_class['subj_label'])[0]
df_class.tail()
| cleaned_tweets | Timestamp | polarity | subjectivity | polar_label | subj_label | |
|---|---|---|---|---|---|---|
| 1995 | indonesia men single rise anthony sinisuka gin... | 2021-07-31 07:20:01 | 0.089286 | 0.273810 | 1 | 1 |
| 1996 | fight place semifinal cest srjdla | 2021-07-31 07:20:00 | 0.000000 | 0.000000 | 0 | 1 |
| 1997 | little known village kabarwala thrower verg | 2021-07-31 07:20:00 | -0.187500 | 0.500000 | 2 | 2 |
| 1998 | one win gold nesthy petecio fight woman feathe... | 2021-07-31 07:19:59 | 0.169444 | 0.647222 | 1 | 0 |
| 1999 | hello tokyo | 2021-07-31 07:19:59 | 0.000000 | 0.000000 | 0 | 1 |
Polarity:
- neutral = 1
- positive = 2
- negative = 0
Subjectivity:
- subjective = 0
- objective = 1
- neutral = 2
Word vectorization
import pandas as pd
from sklearn.feature_extraction.text import CountVectorizer, ENGLISH_STOP_WORDS

vect = CountVectorizer(max_features=200, token_pattern=r'[A-Za-z]+', stop_words=ENGLISH_STOP_WORDS)
vect.fit(df_class.cleaned_tweets)
vect_trans = vect.transform(df_class.cleaned_tweets)
tweet_class = pd.DataFrame(vect_trans.toarray(), columns=vect.get_feature_names())
tweet_class['polar_label'] = df_class.polar_label
tweet_class['subj_label'] = df_class.subj_label
tweet_class.tail(10)
| aapne | advance | amazing | amp | anders | anthony | antonsen | assured | athle | athlete | ... | wanting | watch | win | winning | witness | woman | world | wow | polar_label | subj_label | |
|---|---|---|---|---|---|---|---|---|---|---|---|---|---|---|---|---|---|---|---|---|---|
| 1990 | 0 | 0 | 0 | 0 | 0 | 0 | 0 | 0 | 0 | 0 | ... | 0 | 0 | 0 | 0 | 0 | 0 | 0 | 0 | 1 | 1 |
| 1991 | 0 | 0 | 0 | 0 | 0 | 0 | 0 | 0 | 0 | 1 | ... | 0 | 0 | 0 | 0 | 0 | 0 | 0 | 0 | 0 | 1 |
| 1992 | 0 | 0 | 0 | 0 | 0 | 0 | 0 | 0 | 0 | 0 | ... | 0 | 0 | 0 | 0 | 0 | 0 | 0 | 0 | 2 | 1 |
| 1993 | 0 | 0 | 0 | 0 | 0 | 1 | 0 | 0 | 0 | 0 | ... | 0 | 0 | 0 | 0 | 0 | 0 | 0 | 0 | 1 | 0 |
| 1994 | 0 | 0 | 0 | 0 | 0 | 0 | 0 | 0 | 0 | 0 | ... | 0 | 0 | 1 | 1 | 0 | 0 | 0 | 0 | 1 | 0 |
| 1995 | 0 | 0 | 0 | 0 | 0 | 1 | 0 | 0 | 0 | 0 | ... | 0 | 0 | 0 | 0 | 0 | 0 | 0 | 0 | 1 | 1 |
| 1996 | 0 | 0 | 0 | 0 | 0 | 0 | 0 | 0 | 0 | 0 | ... | 0 | 0 | 0 | 0 | 0 | 0 | 0 | 0 | 0 | 1 |
| 1997 | 0 | 0 | 0 | 0 | 0 | 0 | 0 | 0 | 0 | 0 | ... | 0 | 0 | 0 | 0 | 0 | 0 | 0 | 0 | 2 | 2 |
| 1998 | 0 | 0 | 0 | 0 | 0 | 0 | 0 | 0 | 0 | 0 | ... | 0 | 0 | 1 | 0 | 0 | 1 | 0 | 0 | 1 | 0 |
| 1999 | 0 | 0 | 0 | 0 | 0 | 0 | 0 | 0 | 0 | 0 | ... | 0 | 0 | 0 | 0 | 0 | 0 | 0 | 0 | 0 | 1 |
10 rows × 202 columns
Training and Evaluation
# Define the vector of targets and matrix of features
y = tweet_class.polar_label
X = tweet_class.drop('polar_label', axis=1)
from sklearn.model_selection import train_test_split
# Split the data into training and testing sets
X_train, X_test, y_train, y_test = train_test_split(X, y, test_size=0.8, random_state=123, stratify=y)
# Import the classification models
from sklearn.linear_model import LogisticRegression
from sklearn.svm import SVC
from sklearn.neural_network import MLPClassifier
lr_model=LogisticRegression().fit(X_train,y_train)
svm_model=SVC().fit(X_train,y_train)
nn_model=MLPClassifier().fit(X_train,y_train)

print('Logistic Regression Accuracy: {:.2f}%'.format(lr_model.score(X_test,y_test)*100))
print('Support Vector Machine Accuracy: {:.2f}%'.format(svm_model.score(X_test,y_test)*100))
print('Neural Network Accuracy: {:.2f}%'.format(nn_model.score(X_test,y_test)*100))
C:\Users\Haziq\Anaconda3\lib\site-packages\sklearn\neural_network\_multilayer_perceptron.py:582: ConvergenceWarning: Stochastic Optimizer: Maximum iterations (200) reached and the optimization hasn't converged yet.
  warnings.warn(


Logistic Regression Accuracy: 81.75%
Support Vector Machine Accuracy: 83.31%
Neural Network Accuracy: 83.44%
from sklearn.metrics import accuracy_score as acs
#make predictions
lr_pred = lr_model.predict(X_test)
svm_pred = svm_model.predict(X_test)
nn_pred = nn_model.predict(X_test)

#accuracy score
from sklearn.metrics import r2_score as r2
print(acs(lr_pred, y_test))
print(acs(svm_pred, y_test))
print(acs(nn_pred, y_test))
0.8175
0.833125
0.834375
Confusion Matrix
import numpy as np
import seaborn as sns
from sklearn.metrics import confusion_matrix
fig, axs = plt.subplots(1,3)
plt.figure(figsize=(10,10))
fig.set_size_inches(40, 10)

lr_cmat = confusion_matrix(y_test,lr_pred)
svm_cmat = confusion_matrix(y_test,svm_pred)
nn_cmat = confusion_matrix(y_test,nn_pred)

color ='vlag'
sns.set(font_scale=2)
fig.suptitle("Prediction Model Confusion Matrix")

sns.heatmap(lr_cmat,annot=True,ax=axs[0],cmap=color)
axs[0].set_title('Logistic Regression')
axs[0].set_xlabel('Actual',fontsize =30)
axs[0].set_ylabel('Predicted',fontsize =30)

sns.heatmap(svm_cmat,annot=True,ax=axs[1],cmap=color)
axs[1].set_title('Support Vector machine')
axs[1].set_xlabel('Actual',fontsize =30)
axs[1].set_ylabel('Predicted',fontsize =30)

sns.heatmap(nn_cmat,annot=True,ax=axs[2],cmap=color)
axs[2].set_title('Neural Network')
axs[2].set_xlabel('Actual',fontsize =30)
axs[2].set_ylabel('Predicted',fontsize =30)

plt.show()

<Figure size 720x720 with 0 Axes>
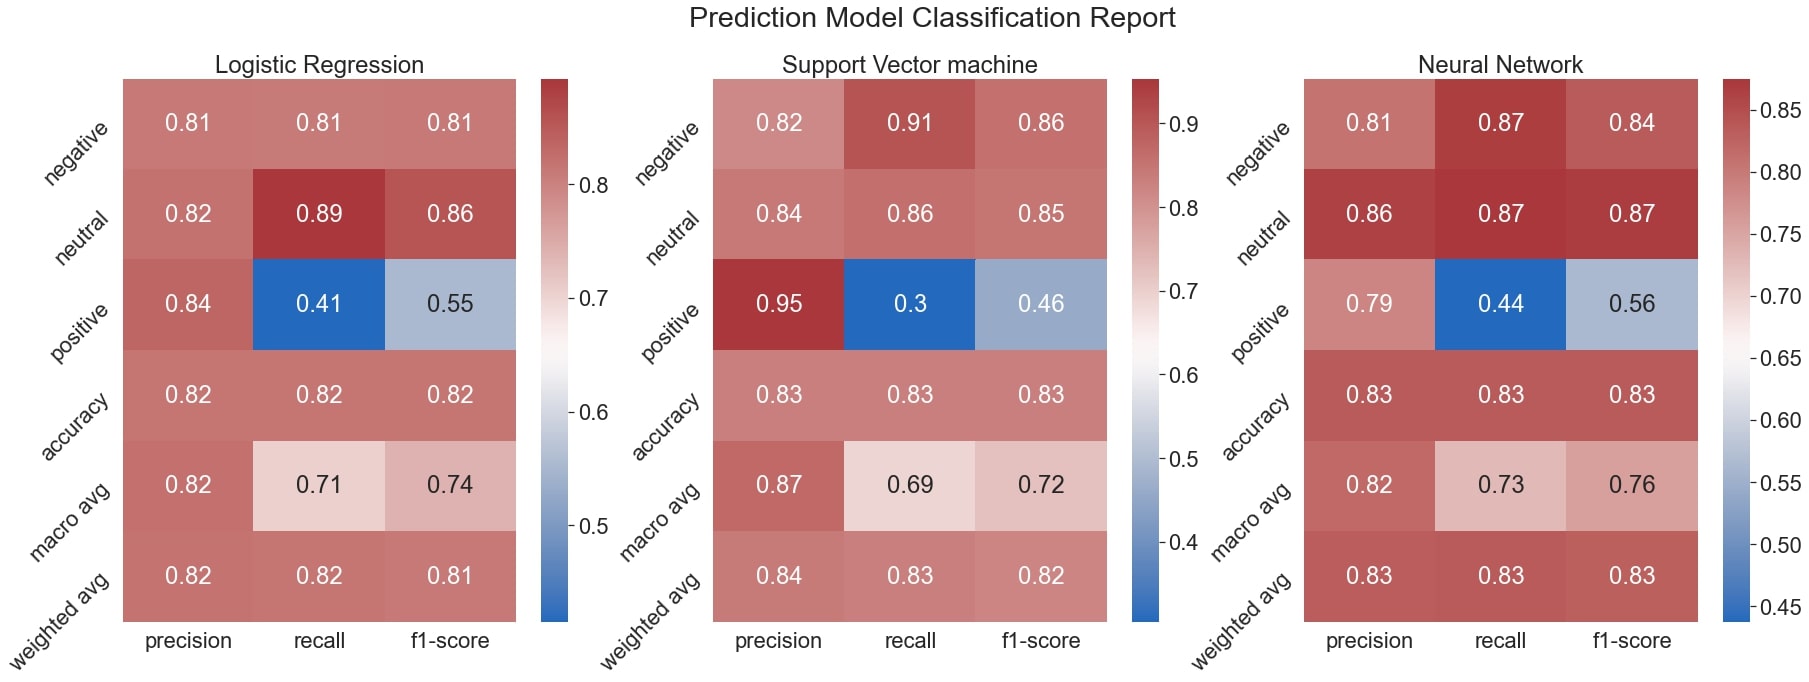
Classification Report
import numpy as np
import seaborn as sns
from sklearn.metrics import classification_report
import pandas as pd
true = y_test
target_names = list(['negative','neutral','positive'])
lr_clf_report = classification_report(true,
                                   lr_pred,
                                   target_names=target_names,
                                   output_dict=True)

svm_clf_report = classification_report(true,
                                   svm_pred,
                                   target_names=target_names,
                                   output_dict=True)

nn_clf_report = classification_report(true,
                                   nn_pred,
                                   target_names=target_names,
                                   output_dict=True)
fig, axs = plt.subplots(1,3)
plt.figure(figsize=(14,10))
fig.set_size_inches(30, 10)

fig.suptitle("Prediction Model Classification Report")

sns.set(font_scale=2)
color ='vlag'

sns.heatmap(pd.DataFrame(lr_clf_report).iloc[:-1, :].T, annot=True,ax=axs[0],cmap=color)
axs[0].set_title('Logistic Regression')
axs[0].tick_params(labelrotation=45,axis='y')


sns.heatmap(pd.DataFrame(svm_clf_report).iloc[:-1, :].T, annot=True,ax=axs[1],cmap=color)
axs[1].set_title('Support Vector machine')
axs[1].tick_params(labelrotation=45,axis='y')


sns.heatmap(pd.DataFrame(nn_clf_report).iloc[:-1, :].T, annot=True,ax=axs[2],cmap=color)
axs[2].set_title('Neural Network')
axs[2].tick_params(labelrotation=45,axis='y')

plt.show()
<Figure size 1008x720 with 0 Axes>